2023 Travel Trends Report
Post-Pandemic State of Travel & Consumer Spending

Hayley Berg - Thu Apr 06 2023
Travel Planning
Travelers are planning trips more last minute than ever before.
After three years of travel restrictions, uncertainty, and disruption, one of the most notable shifts in consumer behavior is how travelers are planning their trips.
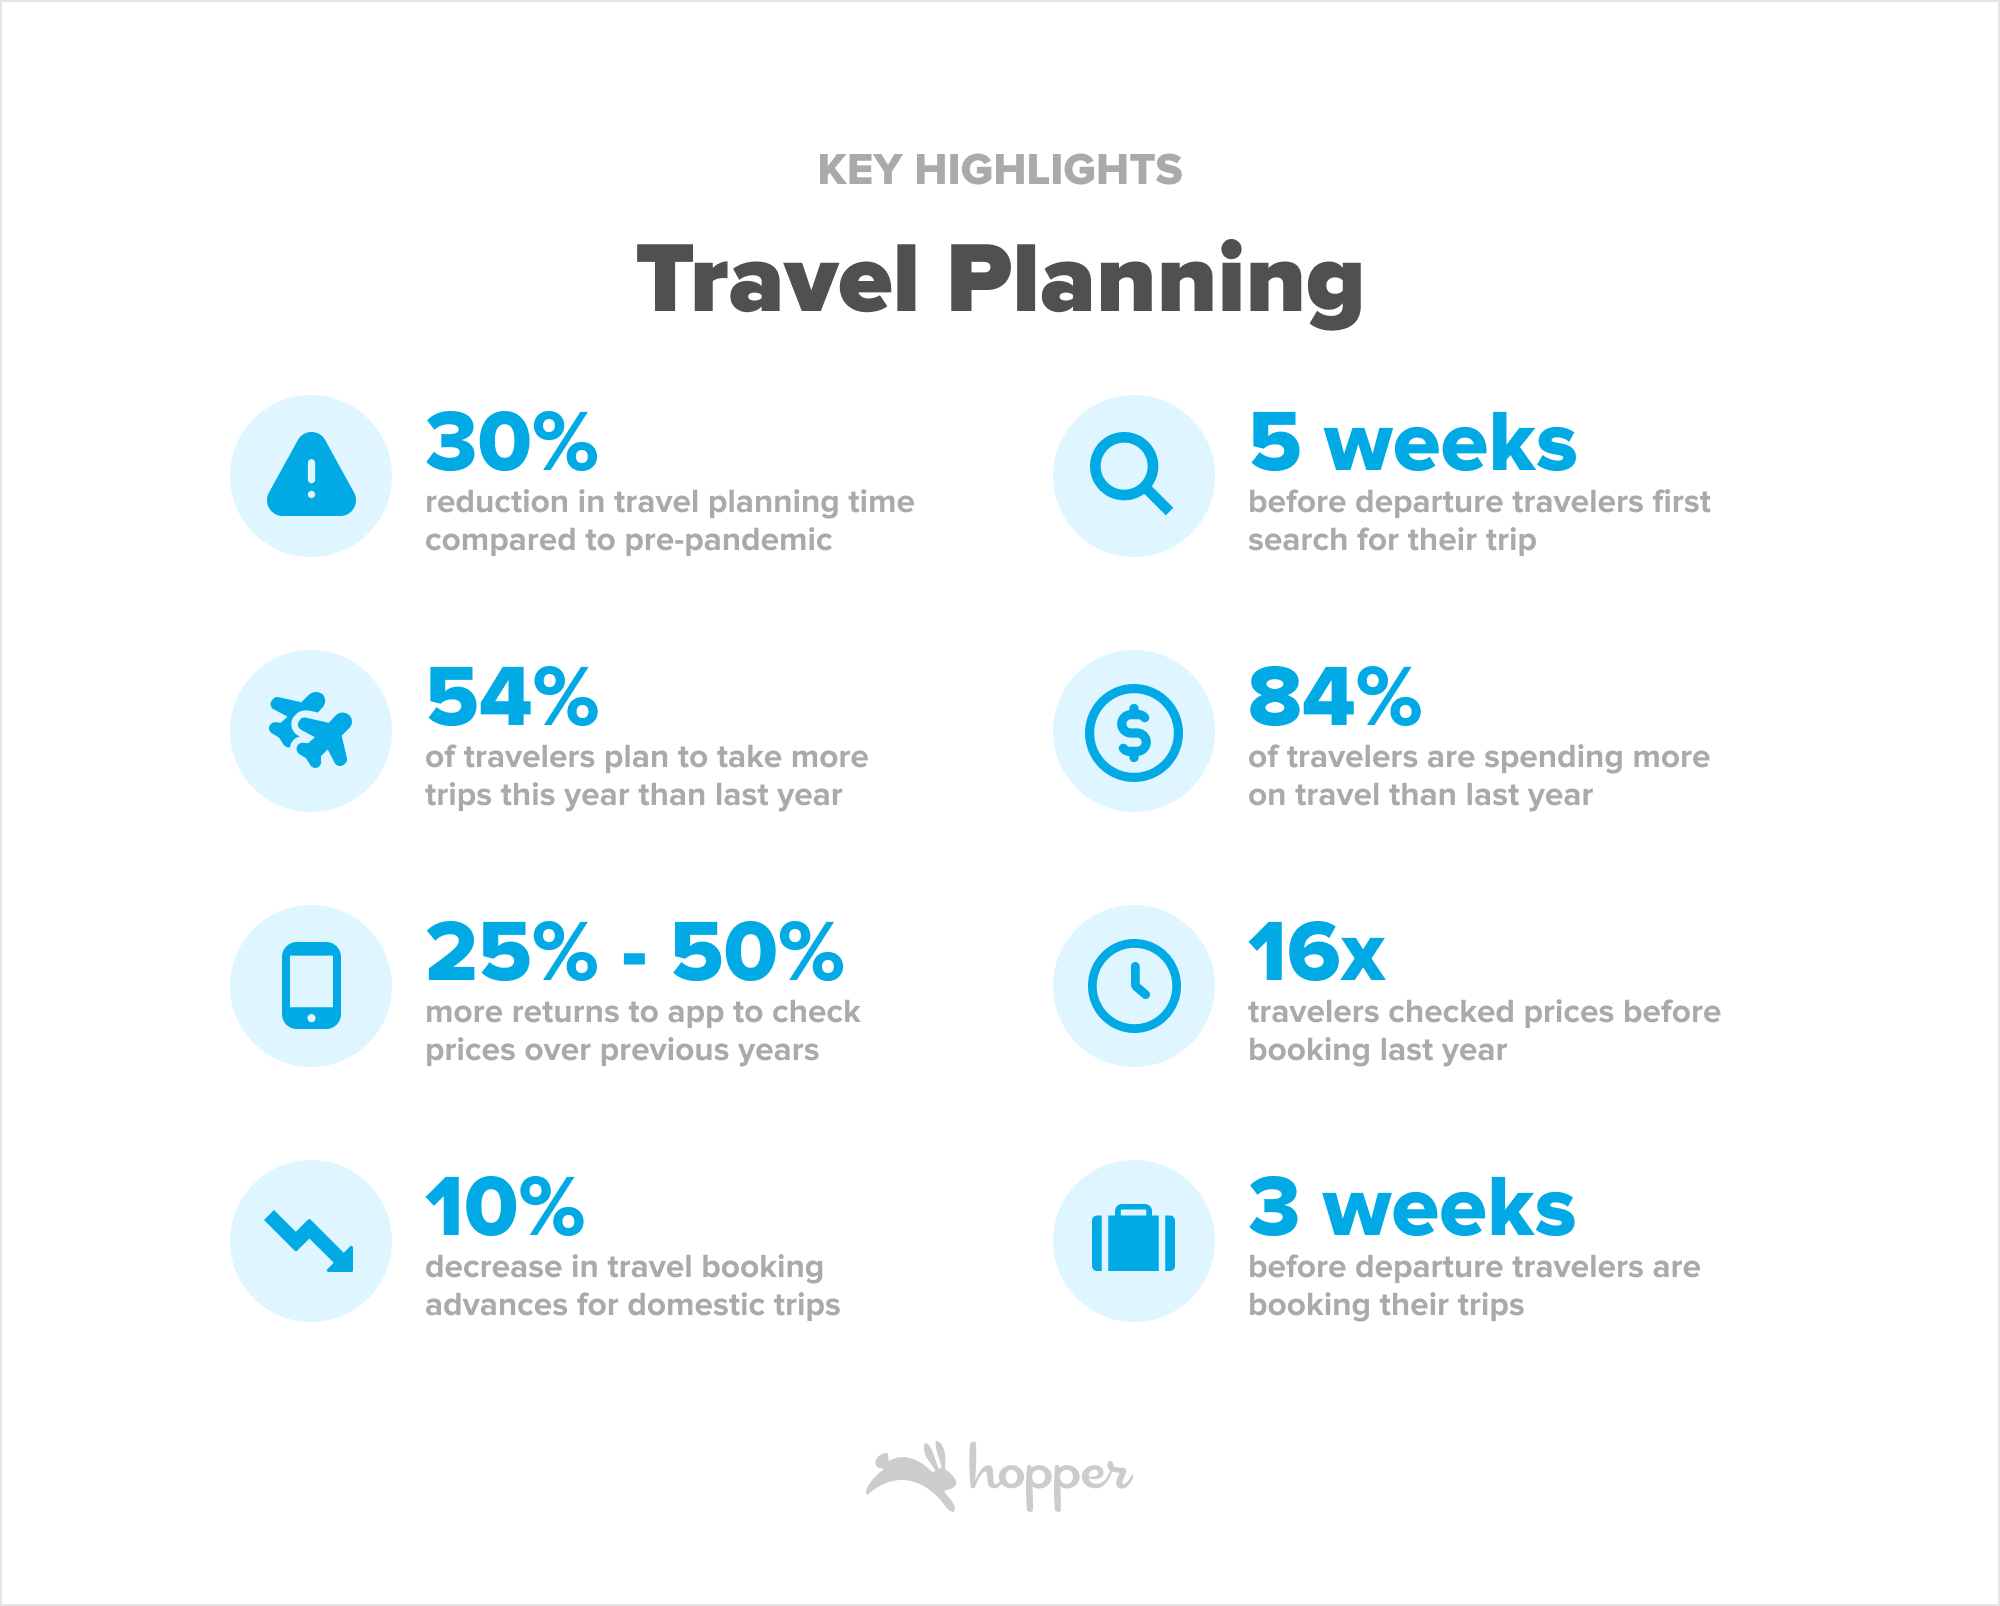
Today, travelers are starting the travel planning process nearly 1.5 weeks closer to their departure dates for domestic trips, about a 30% reduction in travel planning time compared to pre-pandemic. Travelers are making their first search for a trip 5 weeks before departure, compared to nearly 7 weeks before departure pre-pandemic.
Travel planning for international trips has been similarly impacted by more last-minute planning, with the planning process for trips to Europe starting a full two weeks closer to travel dates than in 2019. Trips to South America, Africa, and the Mideast are all being planned at least 2 weeks closer to departure dates, while trips to all other regions of the world are being planned at least 1 week closer to travel dates.
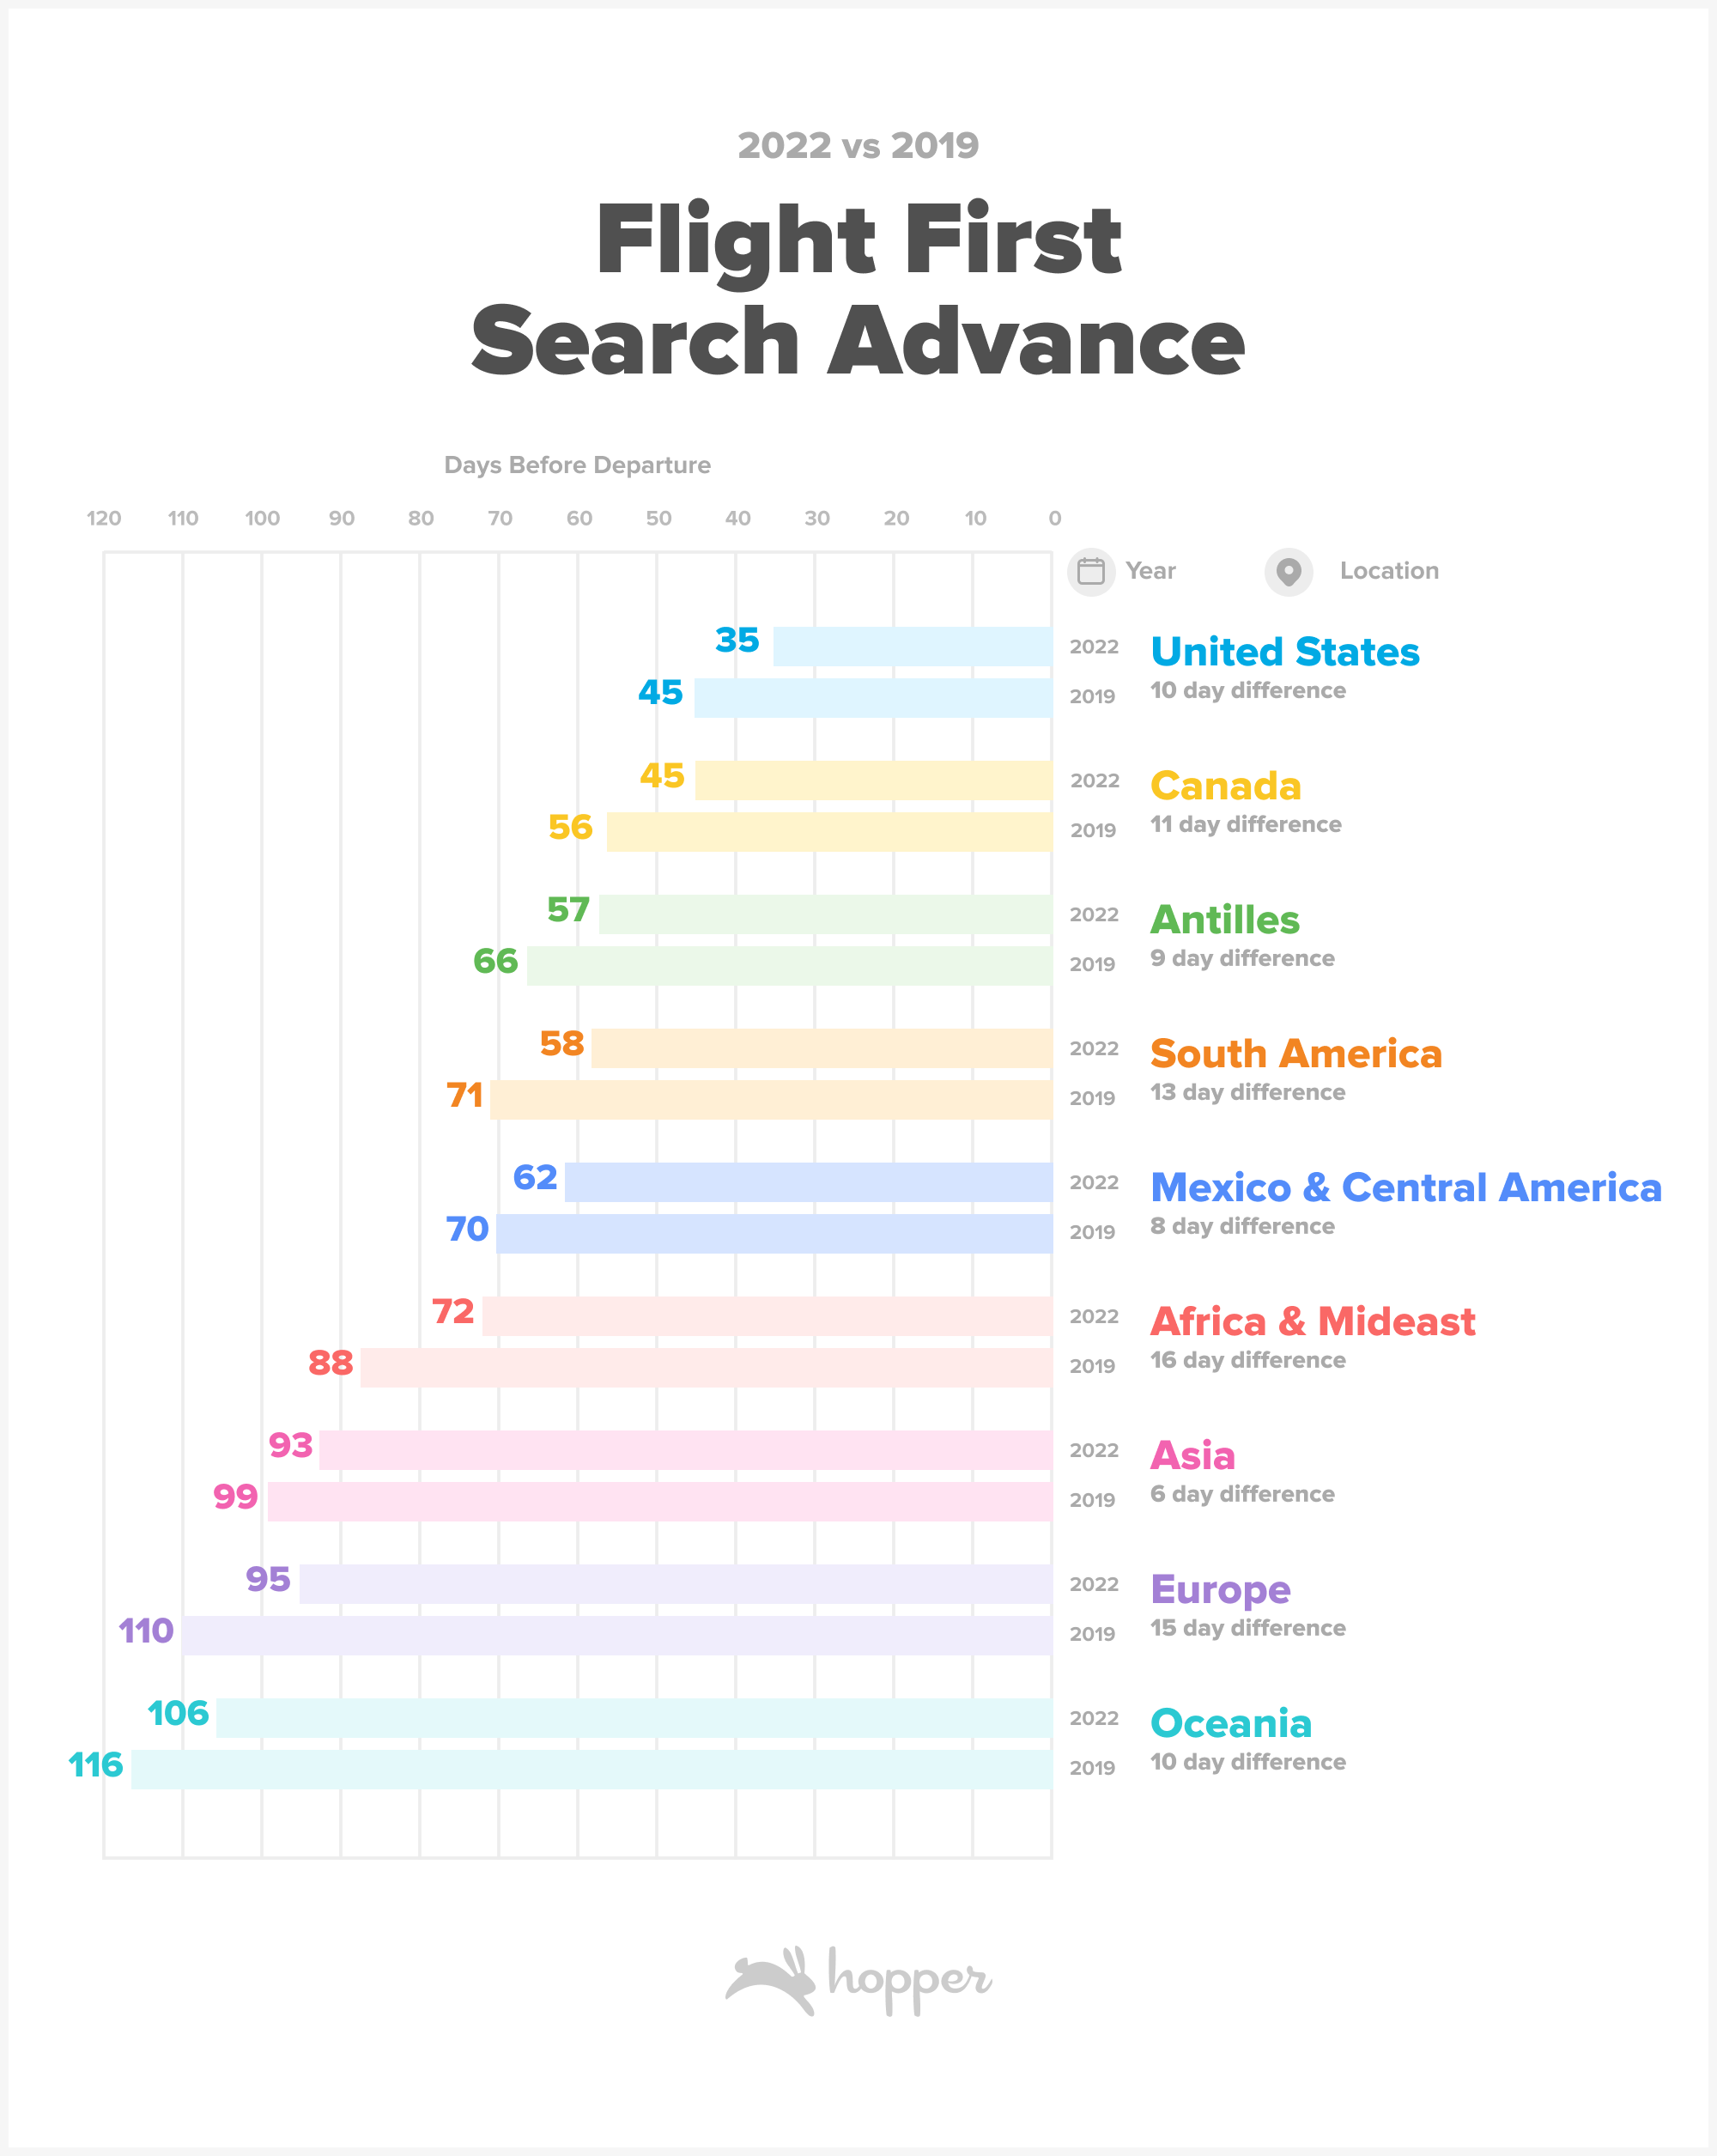
Figure: Average number of days between a travelers first search for a specific trip and travel departure dates. Based on searches made on the Hopper App.
Price anxiety plagues travelers even as they plan to spend more.
With inflation and high interest rates driving up costs for families across the country, wallets, and travel budgets are under more pressure this year than ever before. Finding the lowest price for a trip is critical to these travelers and their ability to get more travel out of their budget.
Even as travelers expect to travel more and spend more, flight and hotel bookers remain incredibly price-conscious. Though travelers started the planning process later in 2022, they returned to the app to check the price of their trip 25% - 50% more than in previous years. Travelers last year checked the price of their domestic trip an average of 16 times before booking, a 33% increase compared to 2019. Trips planned to further flung destinations in Europe, Asia, Africa and the Mideast were price checked 50% more often than in 2019.
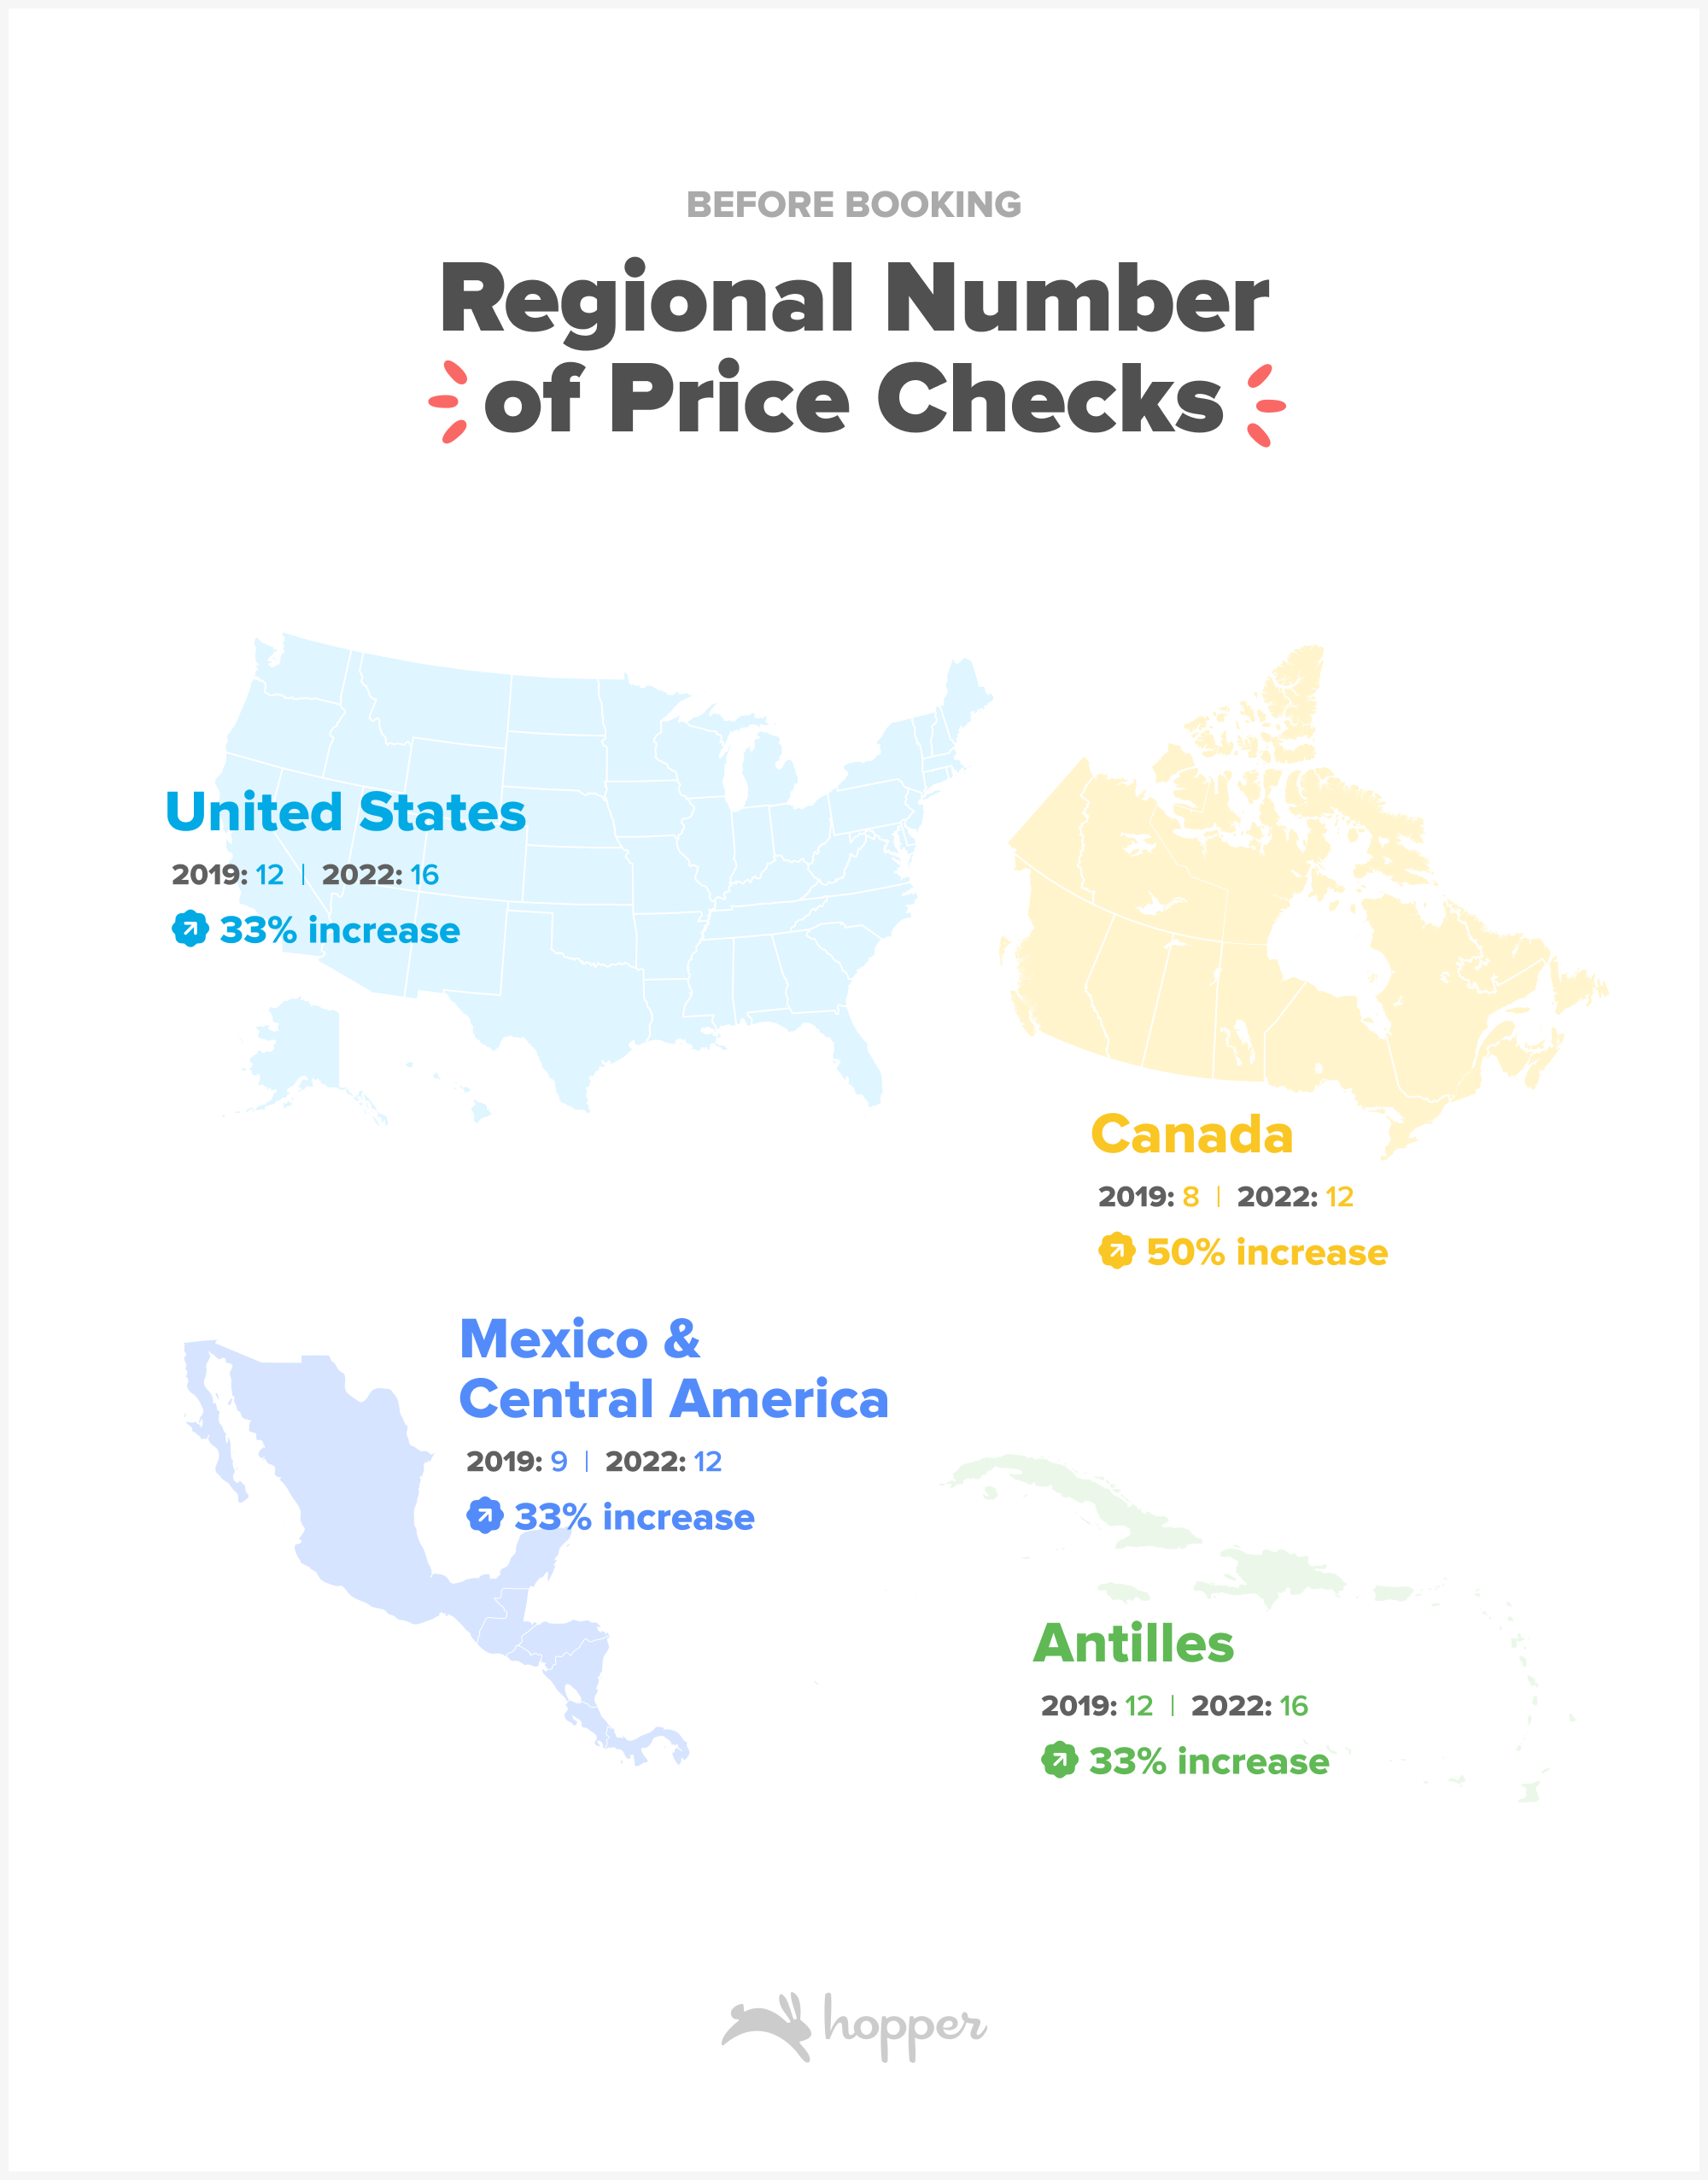
Figure: Average number of times a user checked the price of their trip before booking on the Hopper app.
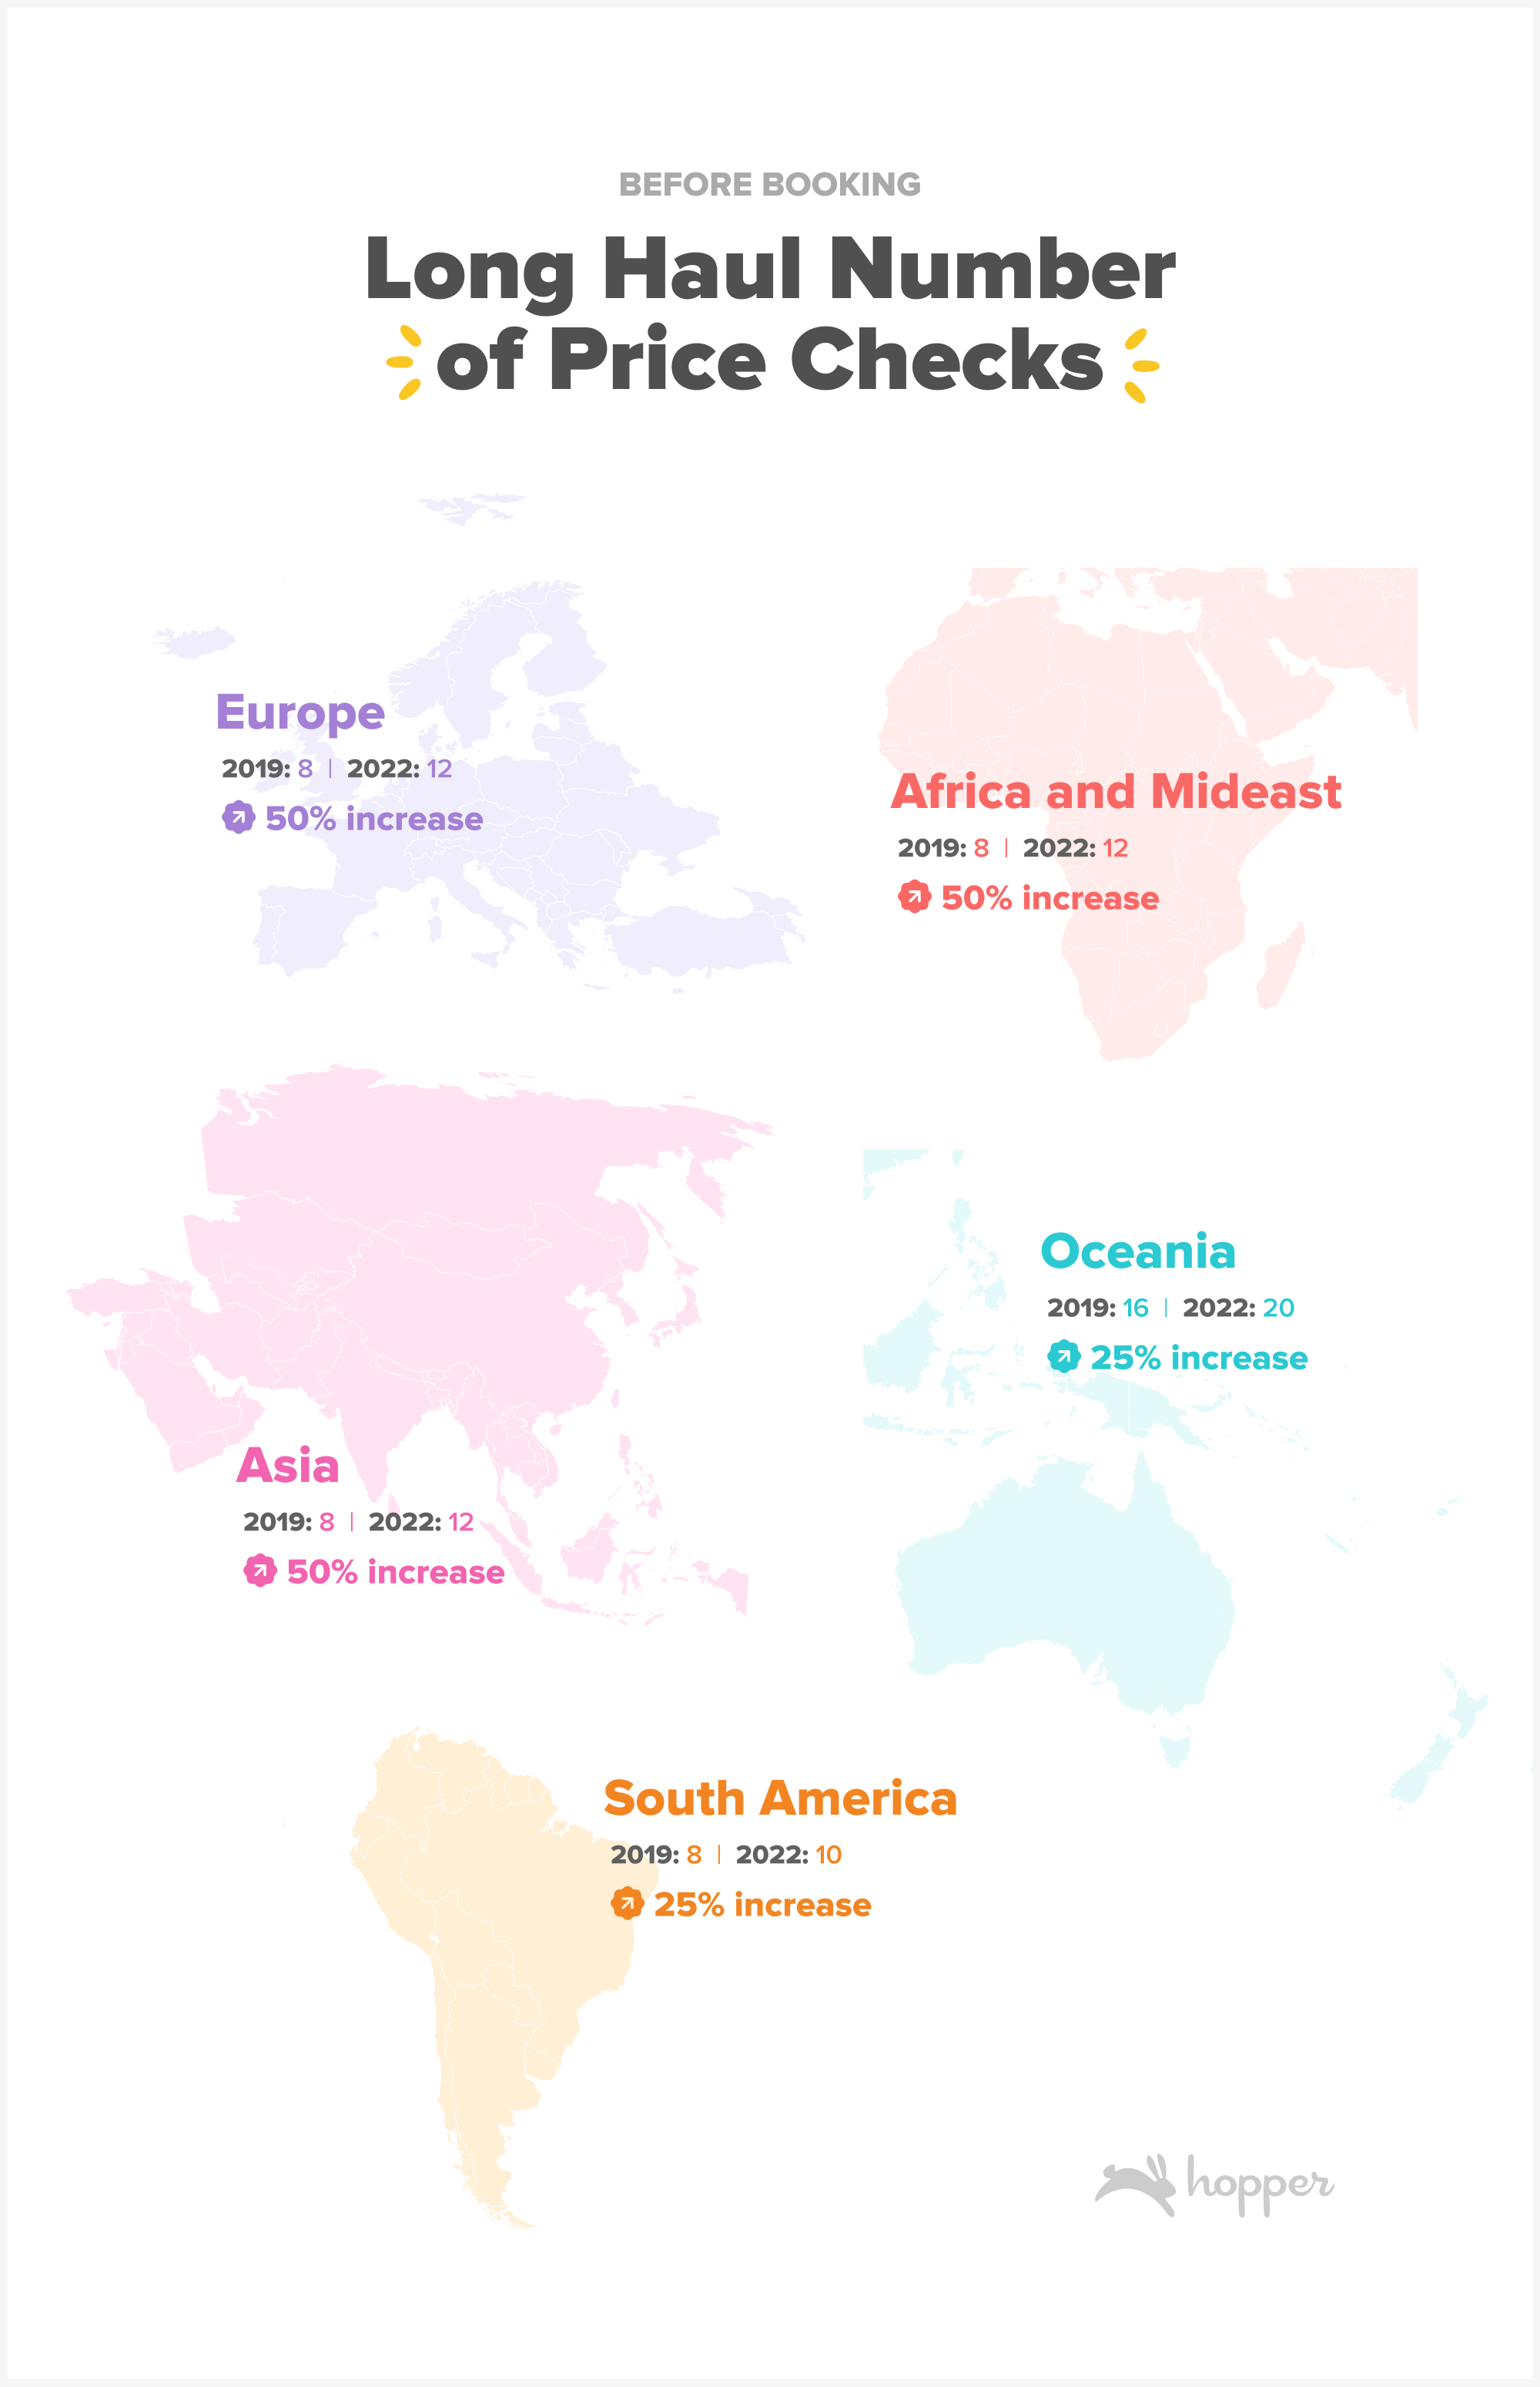
Figure: Average number of times a user checked the price of their trip before booking on the Hopper app.
Travelers are generally flexible on where and when they go.
Flexibility is key to getting the lowest prices on flights and hotels, and the majority of Hopper users have some level of flexibility when starting the travel planning process. 60% of Hopper users are flexible on destination, travel dates or both when they start the travel planning process.
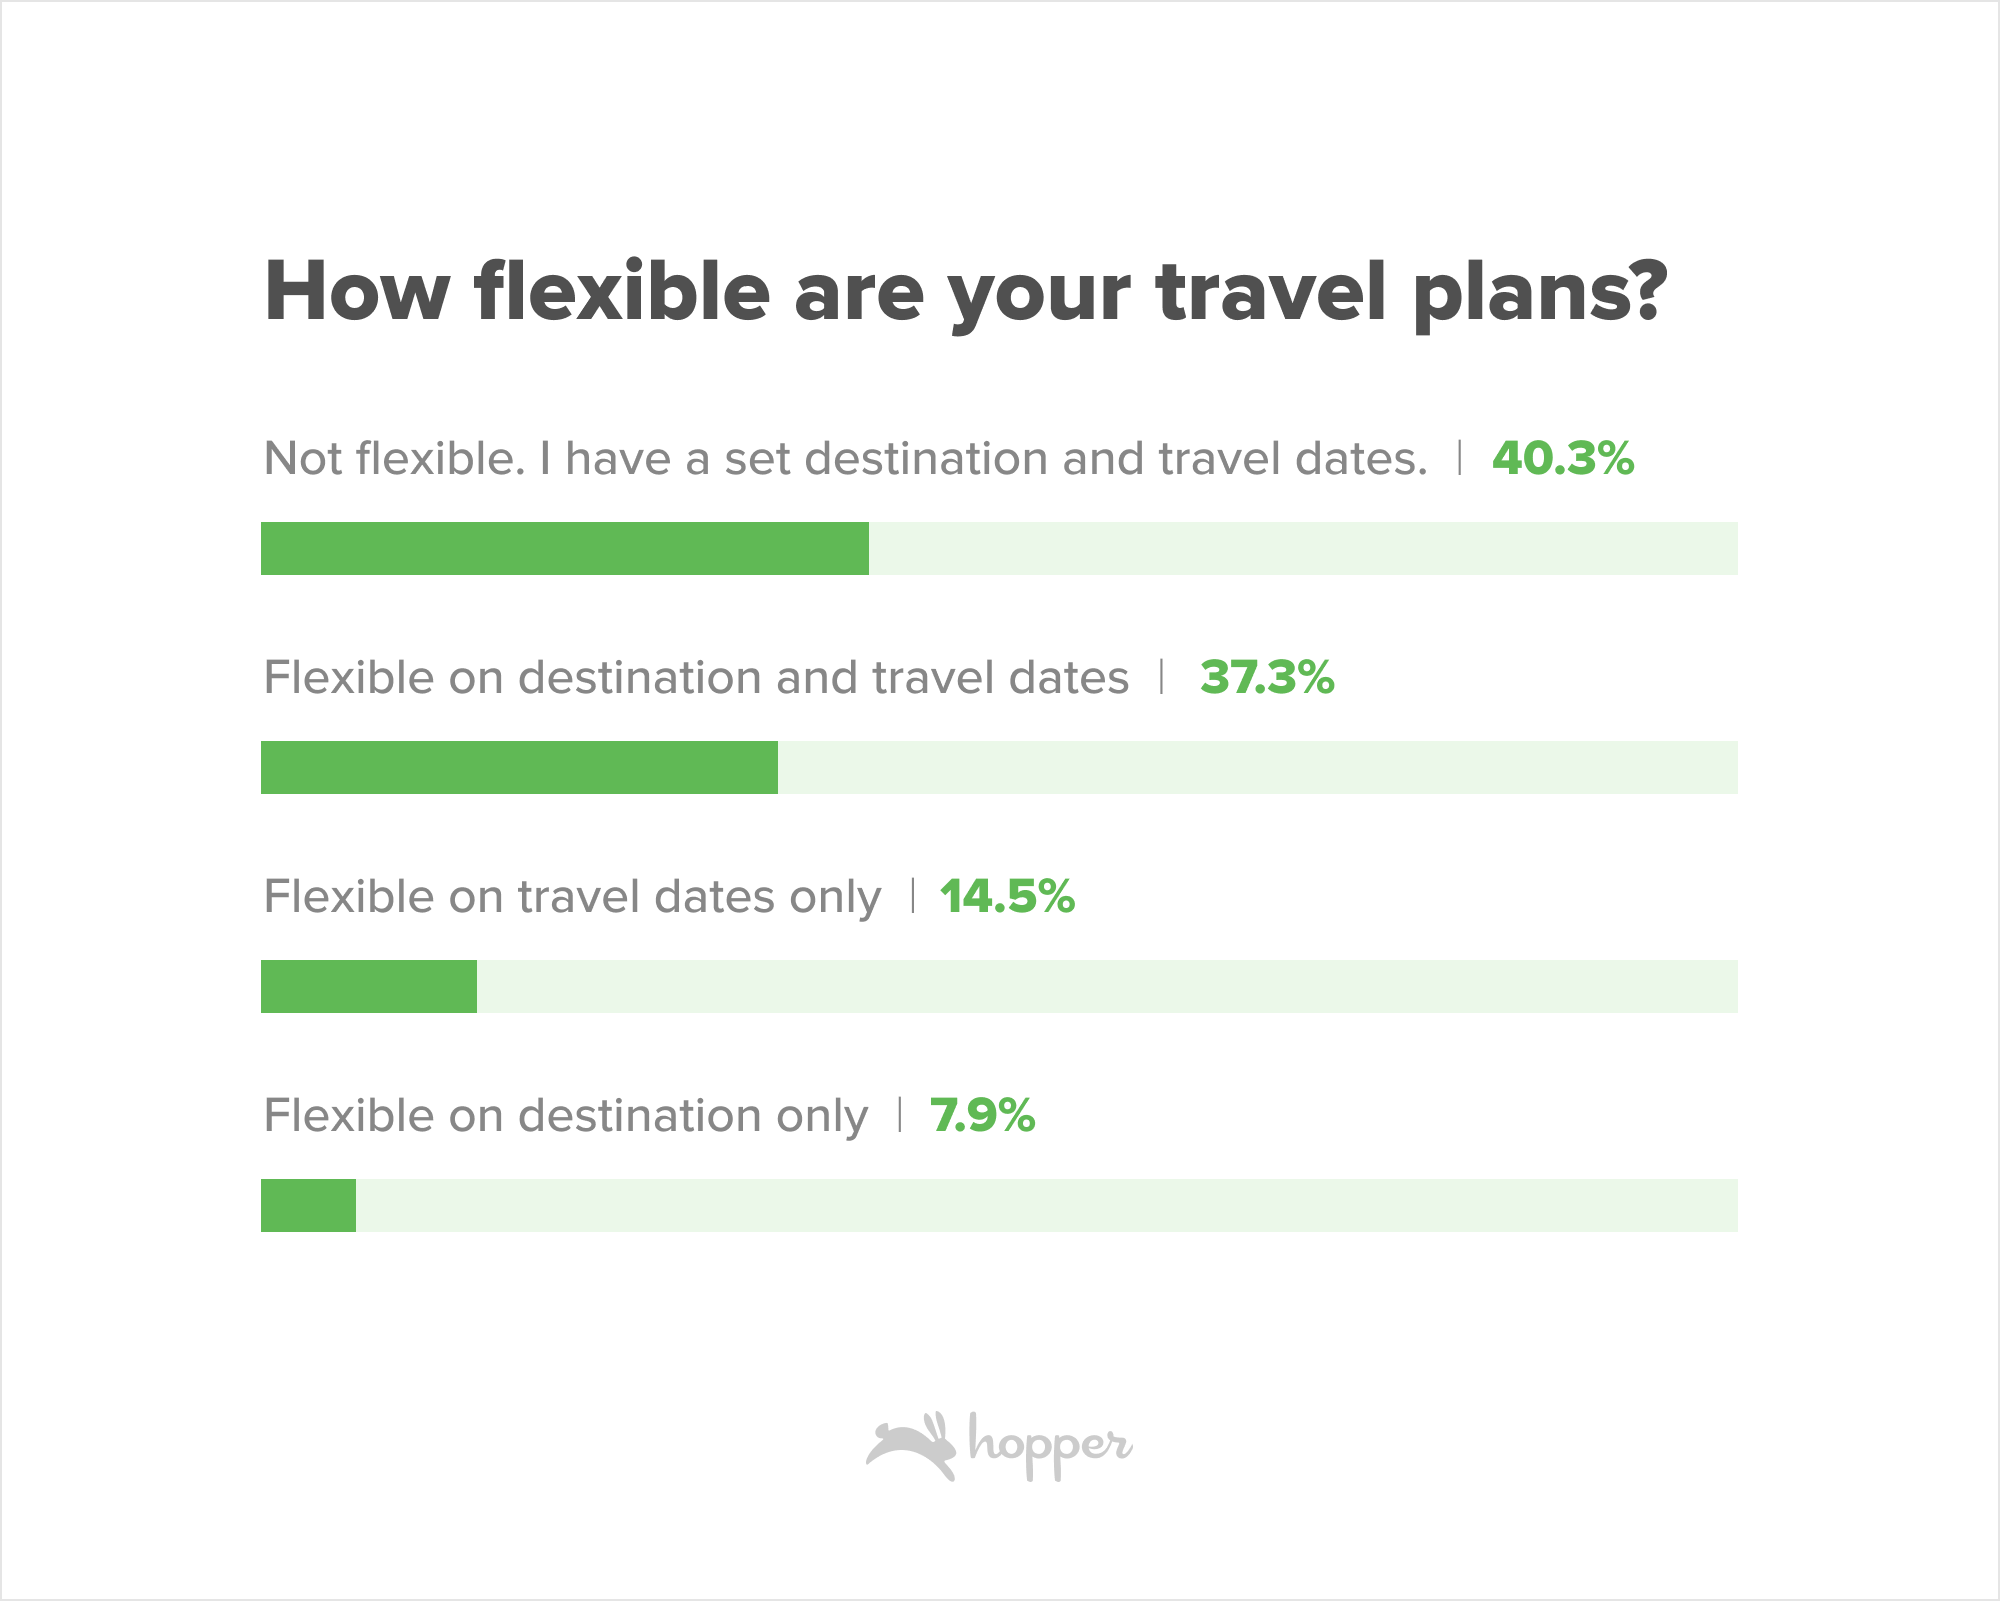
Flexible travelers have the unique advantage of being able to take advantage of the lowest prices, especially when they can travel mid-week or at off-peak times of day. Travelers who fly mid-week can save an average of $90 off of domestic airfare, and over $140 on international airfare. Skipping the Saturday night stay at a hotel can also save travelers an average of 25% off their nightly rate. In popular weekend cities like Las Vegas and Miami, skipping the weekend stay can save travelers premiums over 80% on Saturday night bookings.
Social media continues to play a role in travel planning.
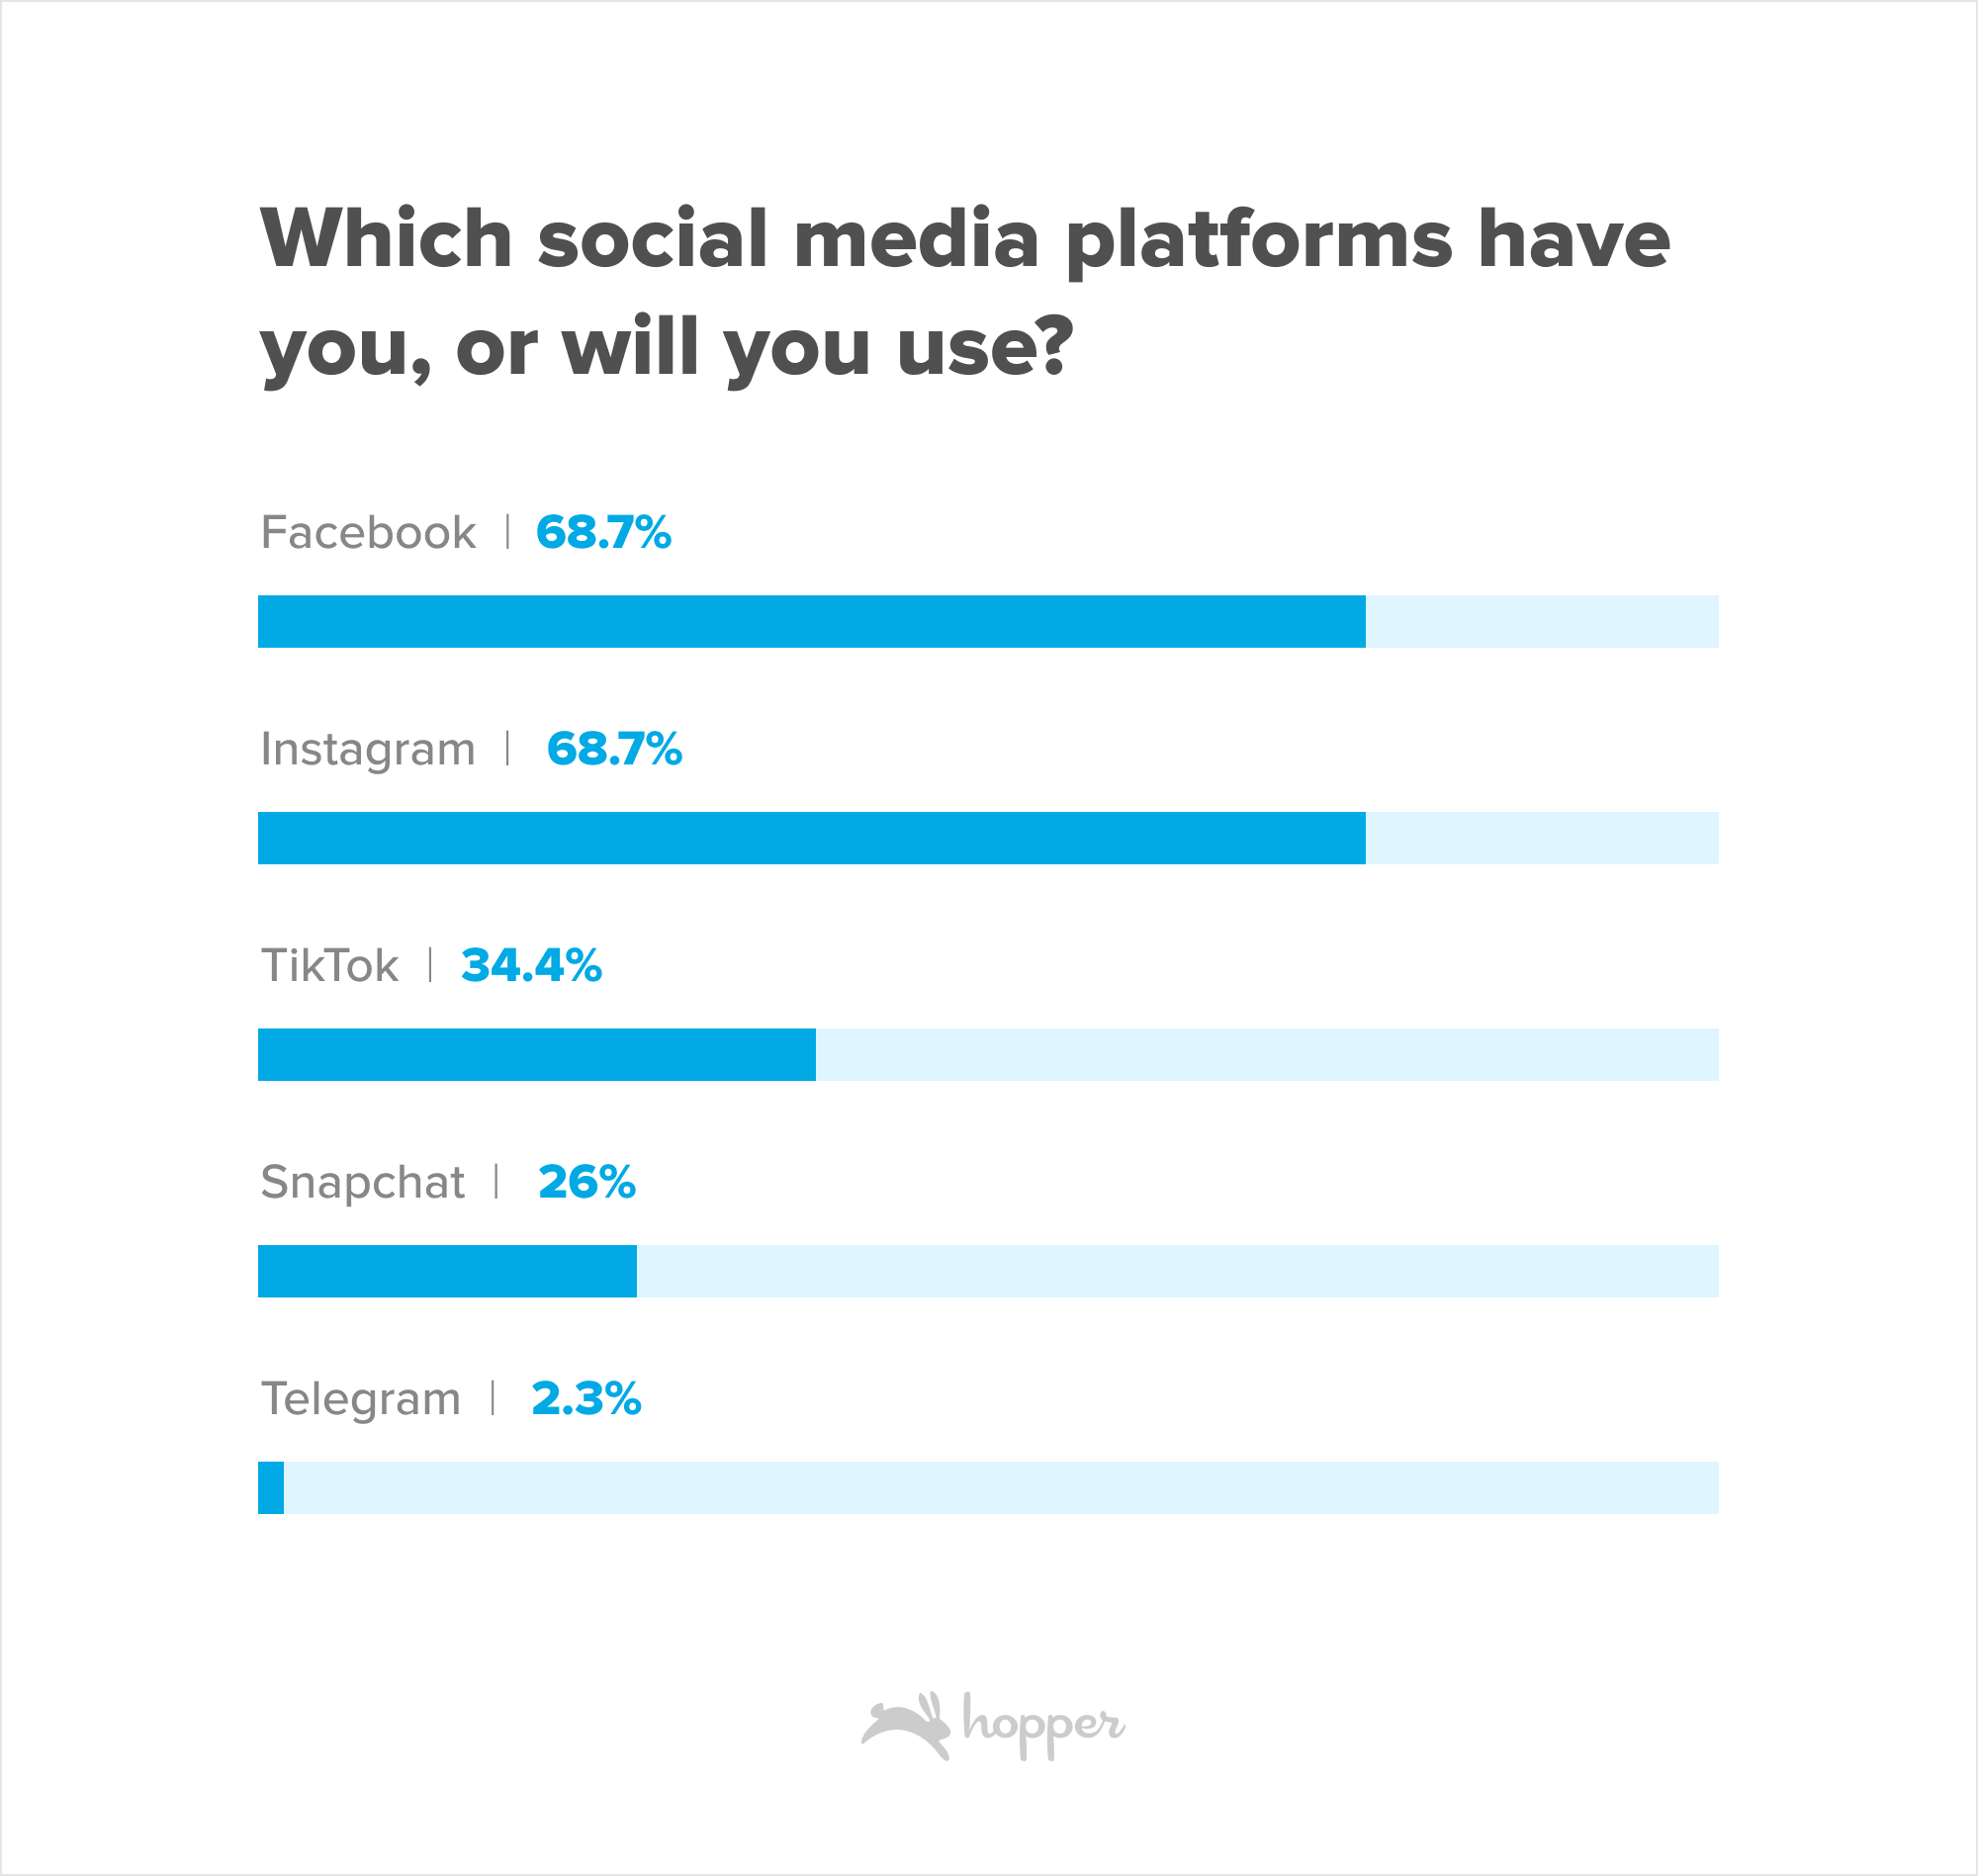
Millennials came of age with social media, while Gen Z has never lived without it. It’s unsurprising, then, that social media is taking an increasing role in the travel planning process. Just under half of Hopper users plan to use social media during the trip planning process for everything from finding destination inspiration to uncovering exclusive deals and discount codes. Facebook and Instagram remain the most popular platforms for travel planning, followed by TikTok and Snapchat.
Travel Booking
Travelers are booking flights more last minute than ever before.
As the travel planning process is starting much later, travel bookings are also happening much closer to travel dates than in 2019. Travel booking advances for domestic trips have shortened by nearly 10%, with bookings being made about 3 weeks ahead of departure compared to 3-4 weeks in 2019.
Trips to Europe, the #1 destination region outside the U.S for American travelers, are being booked a full 2 weeks closer to departure than pre-pandemic, a 20% drop in the overall booking advance. Travelers in 2019 booked trips to Europe 9 weeks ahead of departure compared to just 7 weeks in 2022.
Millennials and Gen Z are more averse to locking in plans.
Hopper users, who are primarily Millennial and Gen Z, book trips further in advance than the general population. Domestic trips in 2022 were booked 4 days earlier on average, while trips to all long haul destinations were booked at least one week earlier than the general population. Trips to Asia were booked a full 3 weeks further in advance by Hopper customers than the rest of the population.
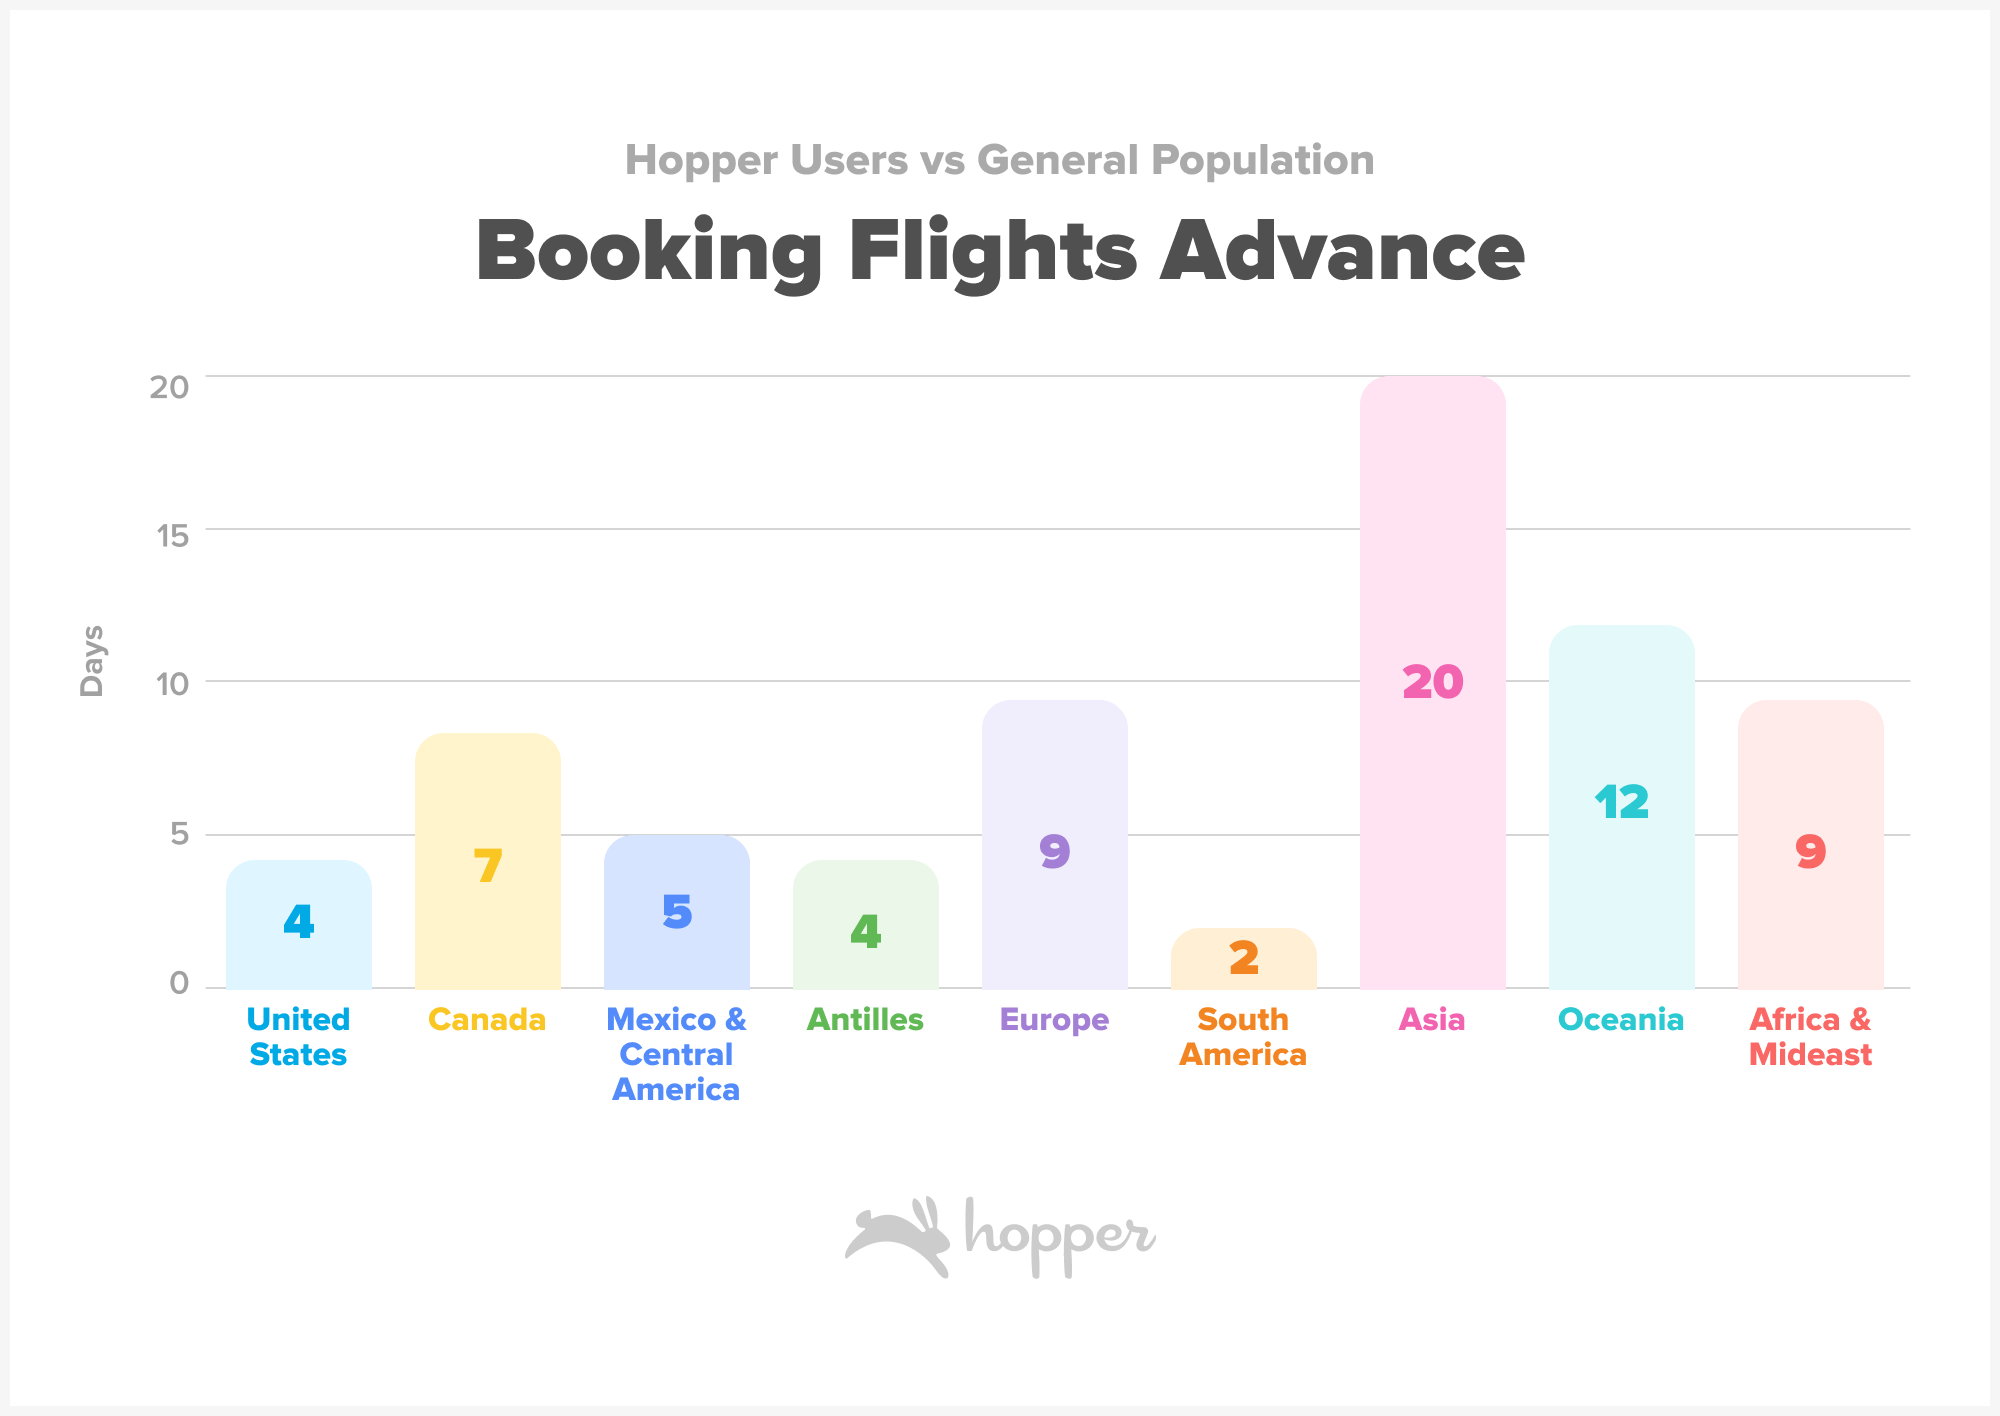
Figure: Difference in average booking advance in days between Hopper users and the general population in 2022.
Though Hopper customers are booking trips further in advance than the general public on average, they are booking significantly closer to departure dates than pre-pandemic. Domestic trip advances have dropped by 22%, double the national average, with bookings being made 3 weeks ahead of departure compared to a full 4 weeks in 2019.
Europe, a top destination for younger generations, has seen a 30% (3 week) drop in the booking advance window from bookings being made 11-12 weeks in advance to just 8-9 weeks. Similarly bookings to South America, Africa and the Mideast are being made 27% or about 2 weeks closer to departure dates.
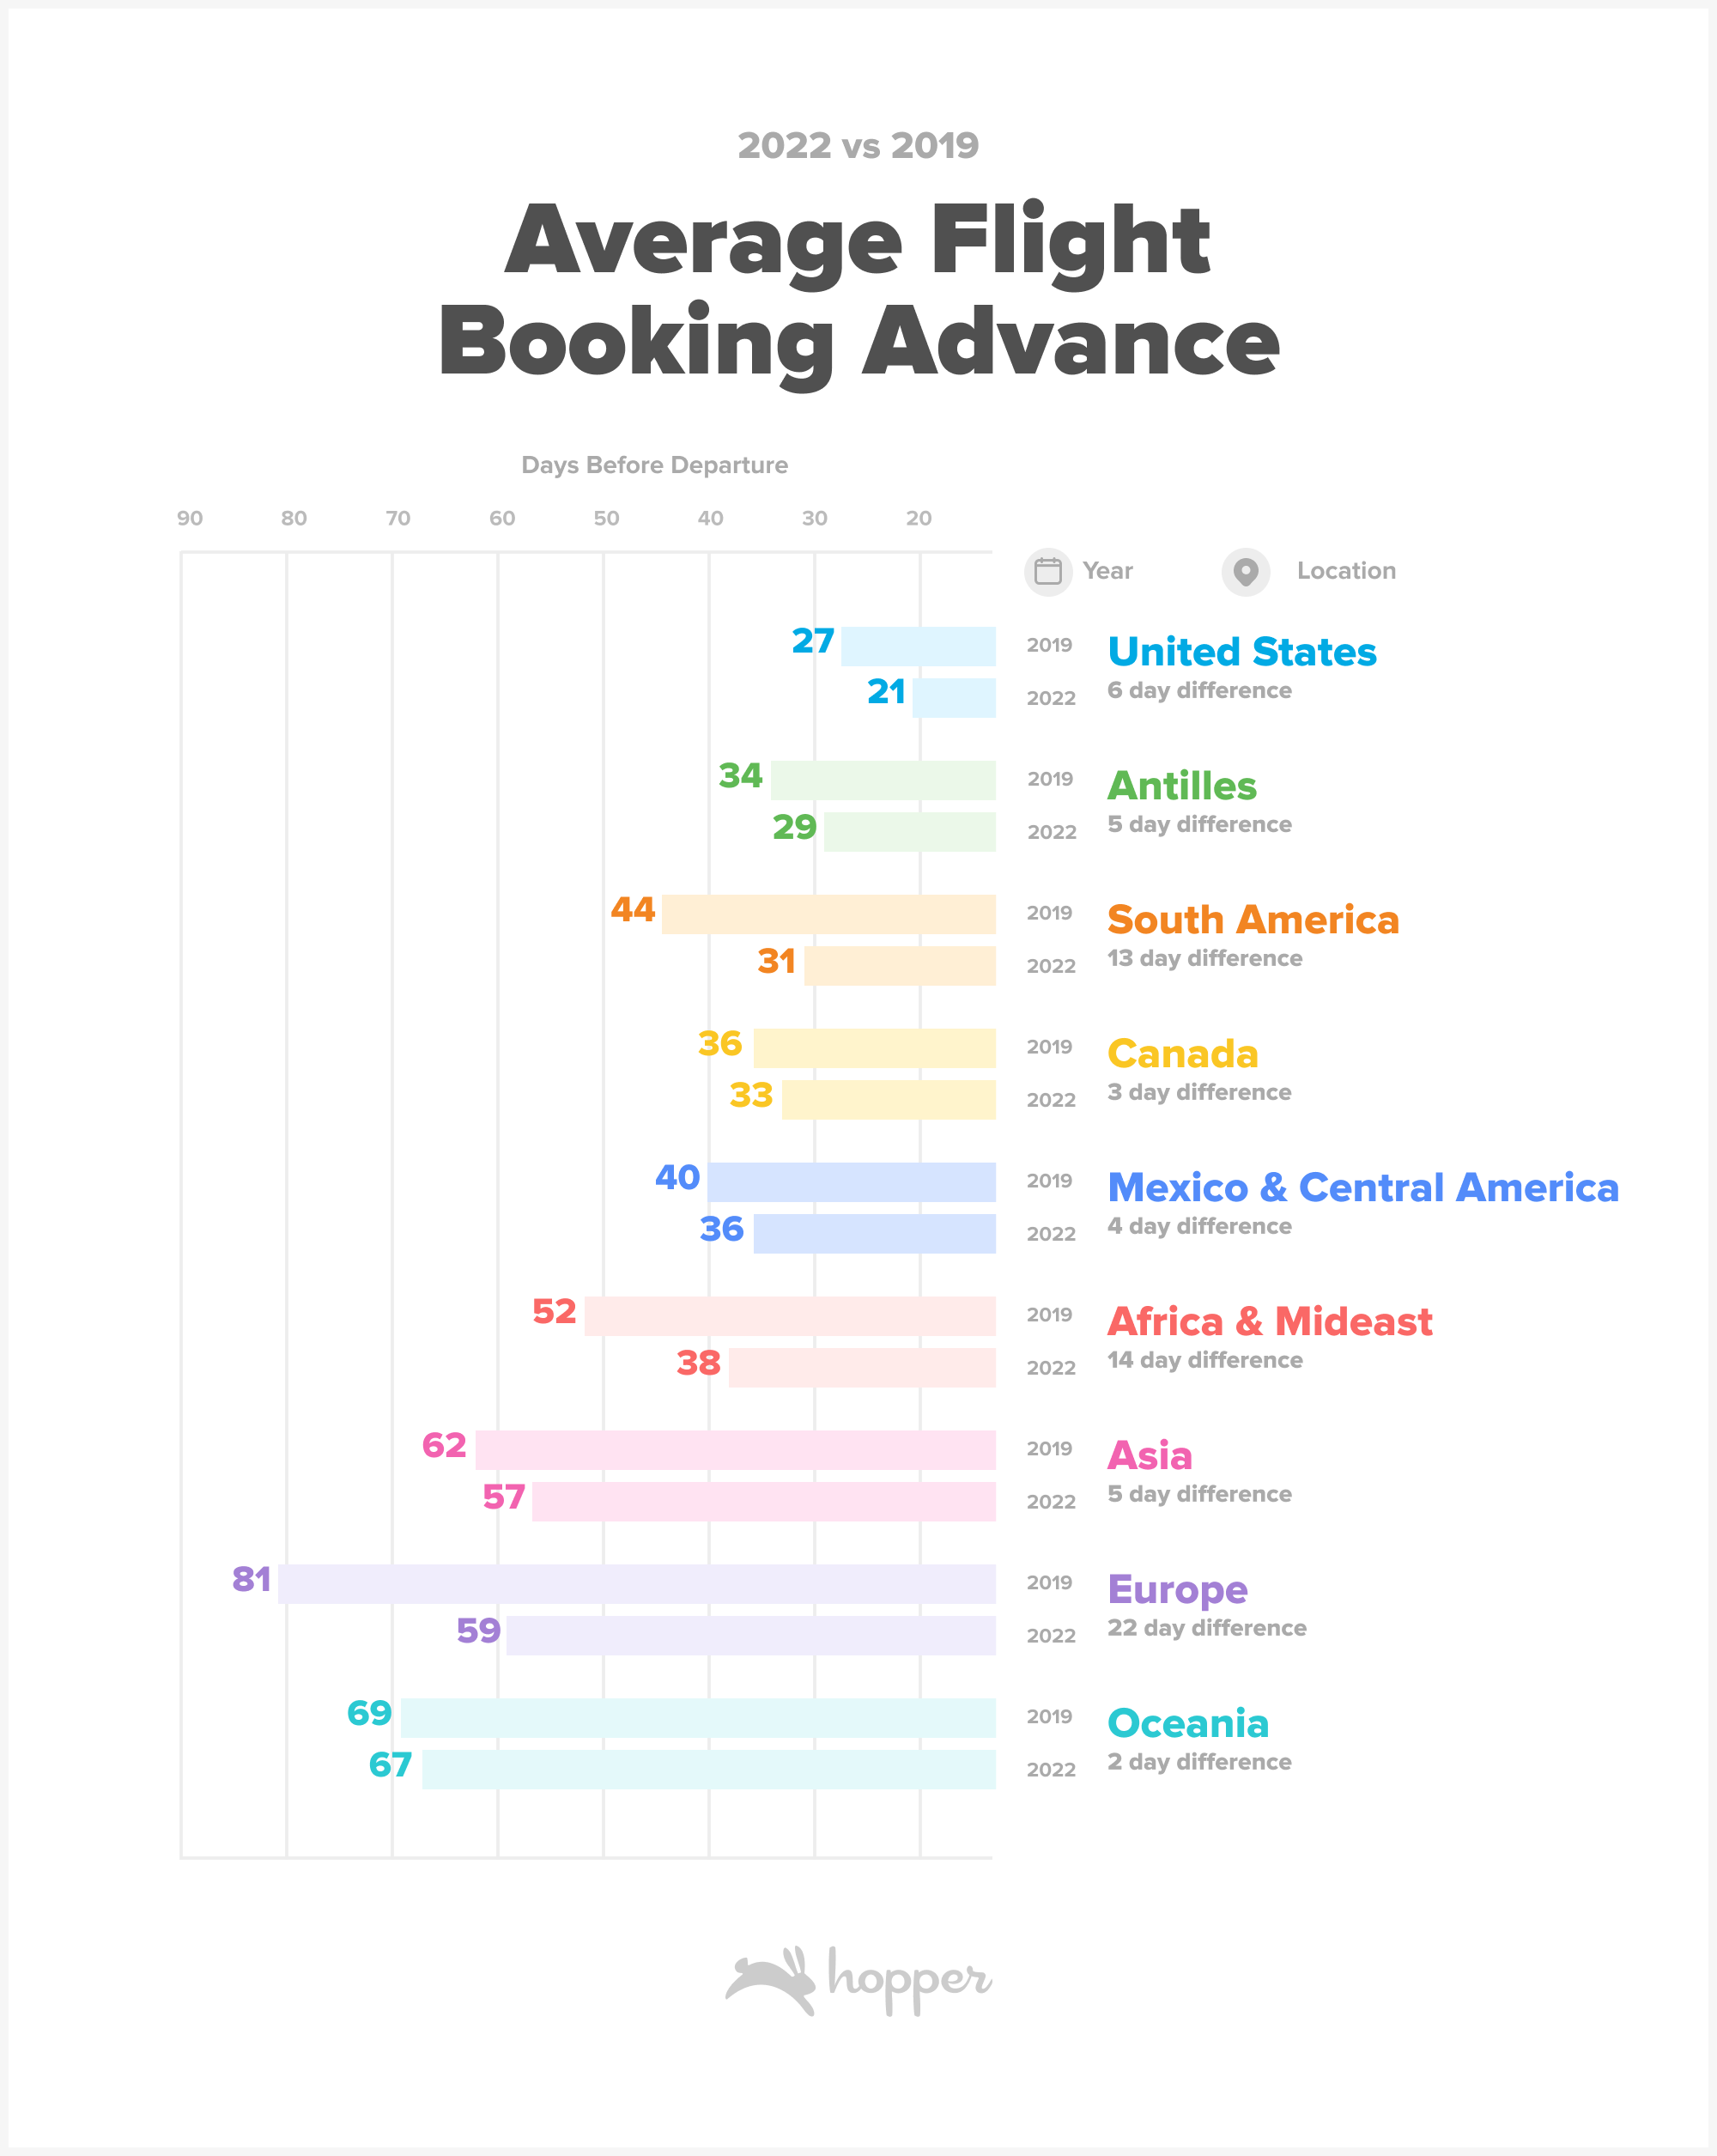
Figure: Average number of days between booking date and departure date on Hopper.
More than half of hotel bookings are made last minute.
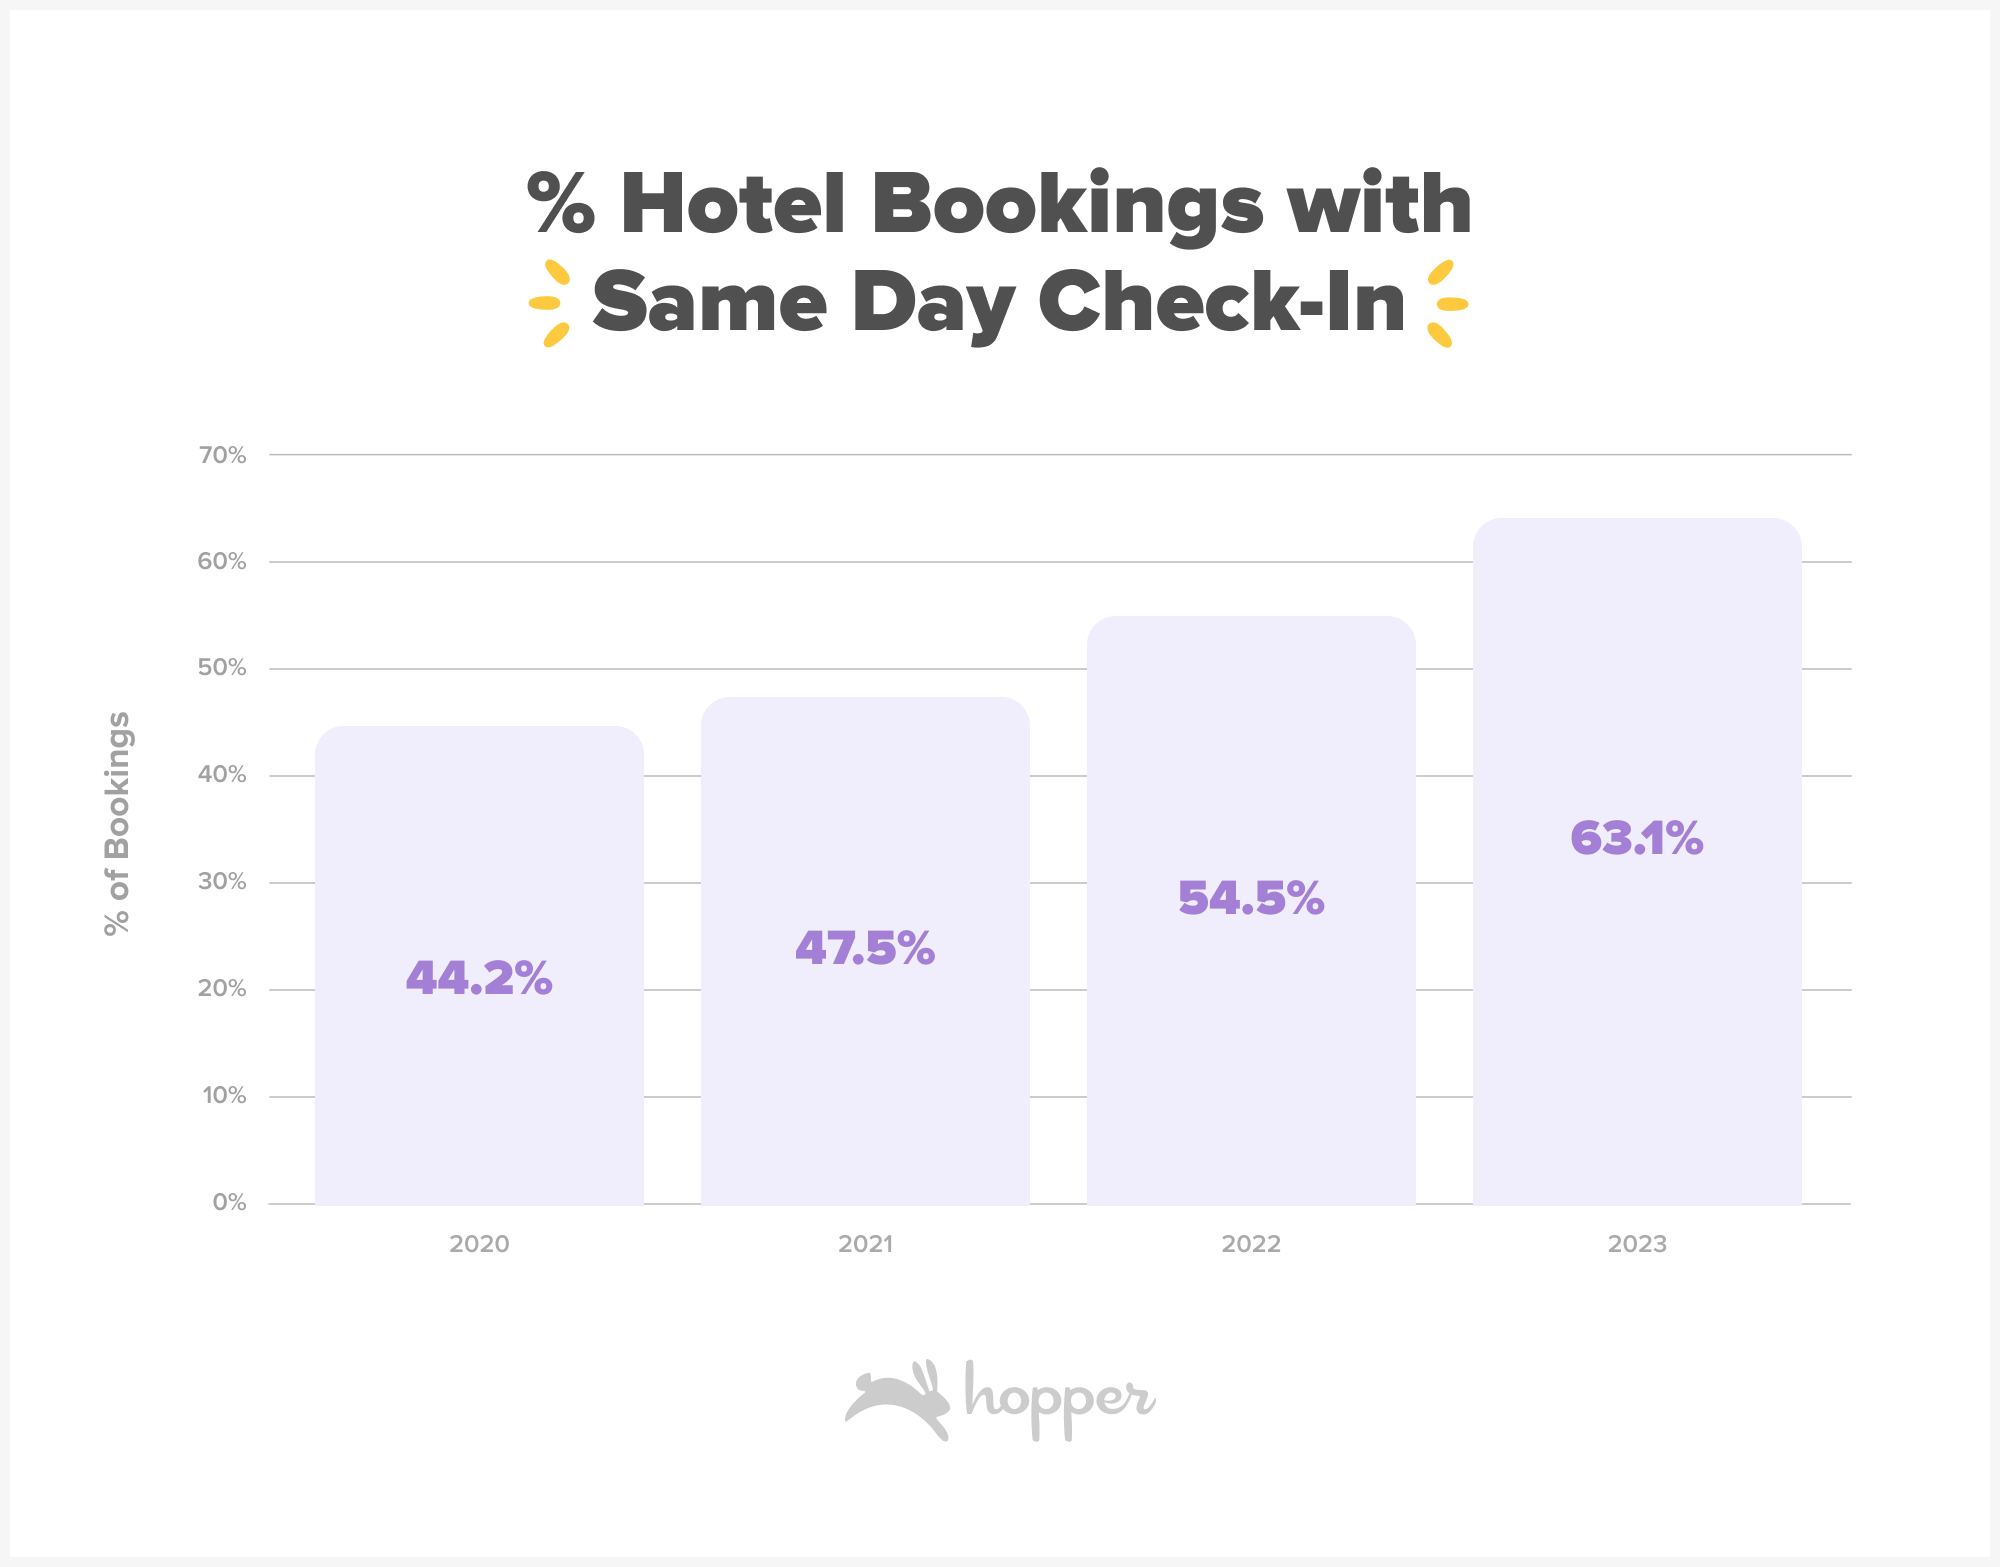
On average 55% of hotel bookings made on the Hopper app in 2022 were for same-day check-in. This is an increase of +7.5% points compared to 2021 and 10.8% points compared to 2020. Bookings made in 2023 are trending even more last minute in the first three months of the year, with 63% of bookings made same-day as check-in.
Travelers can often get lower rates by booking at the last minute in major cities, but run the risk of hotels selling out over event weekends or during peak season. Travelers who don’t book the same-day typically book about 3 weeks before check-in, which has increased from a low of 17 days before check-in in 2021.
Post-Pandemic travel consists of longer long-haul trips and shorter regional trips.
Domestic and regional trips from the U.S remain slightly shorter in the last year than trips booked in 2019. Trips to traditional warm weather destinations in Mexico, Central America and the Antilles have been shortened by a half day on average for all travelers.
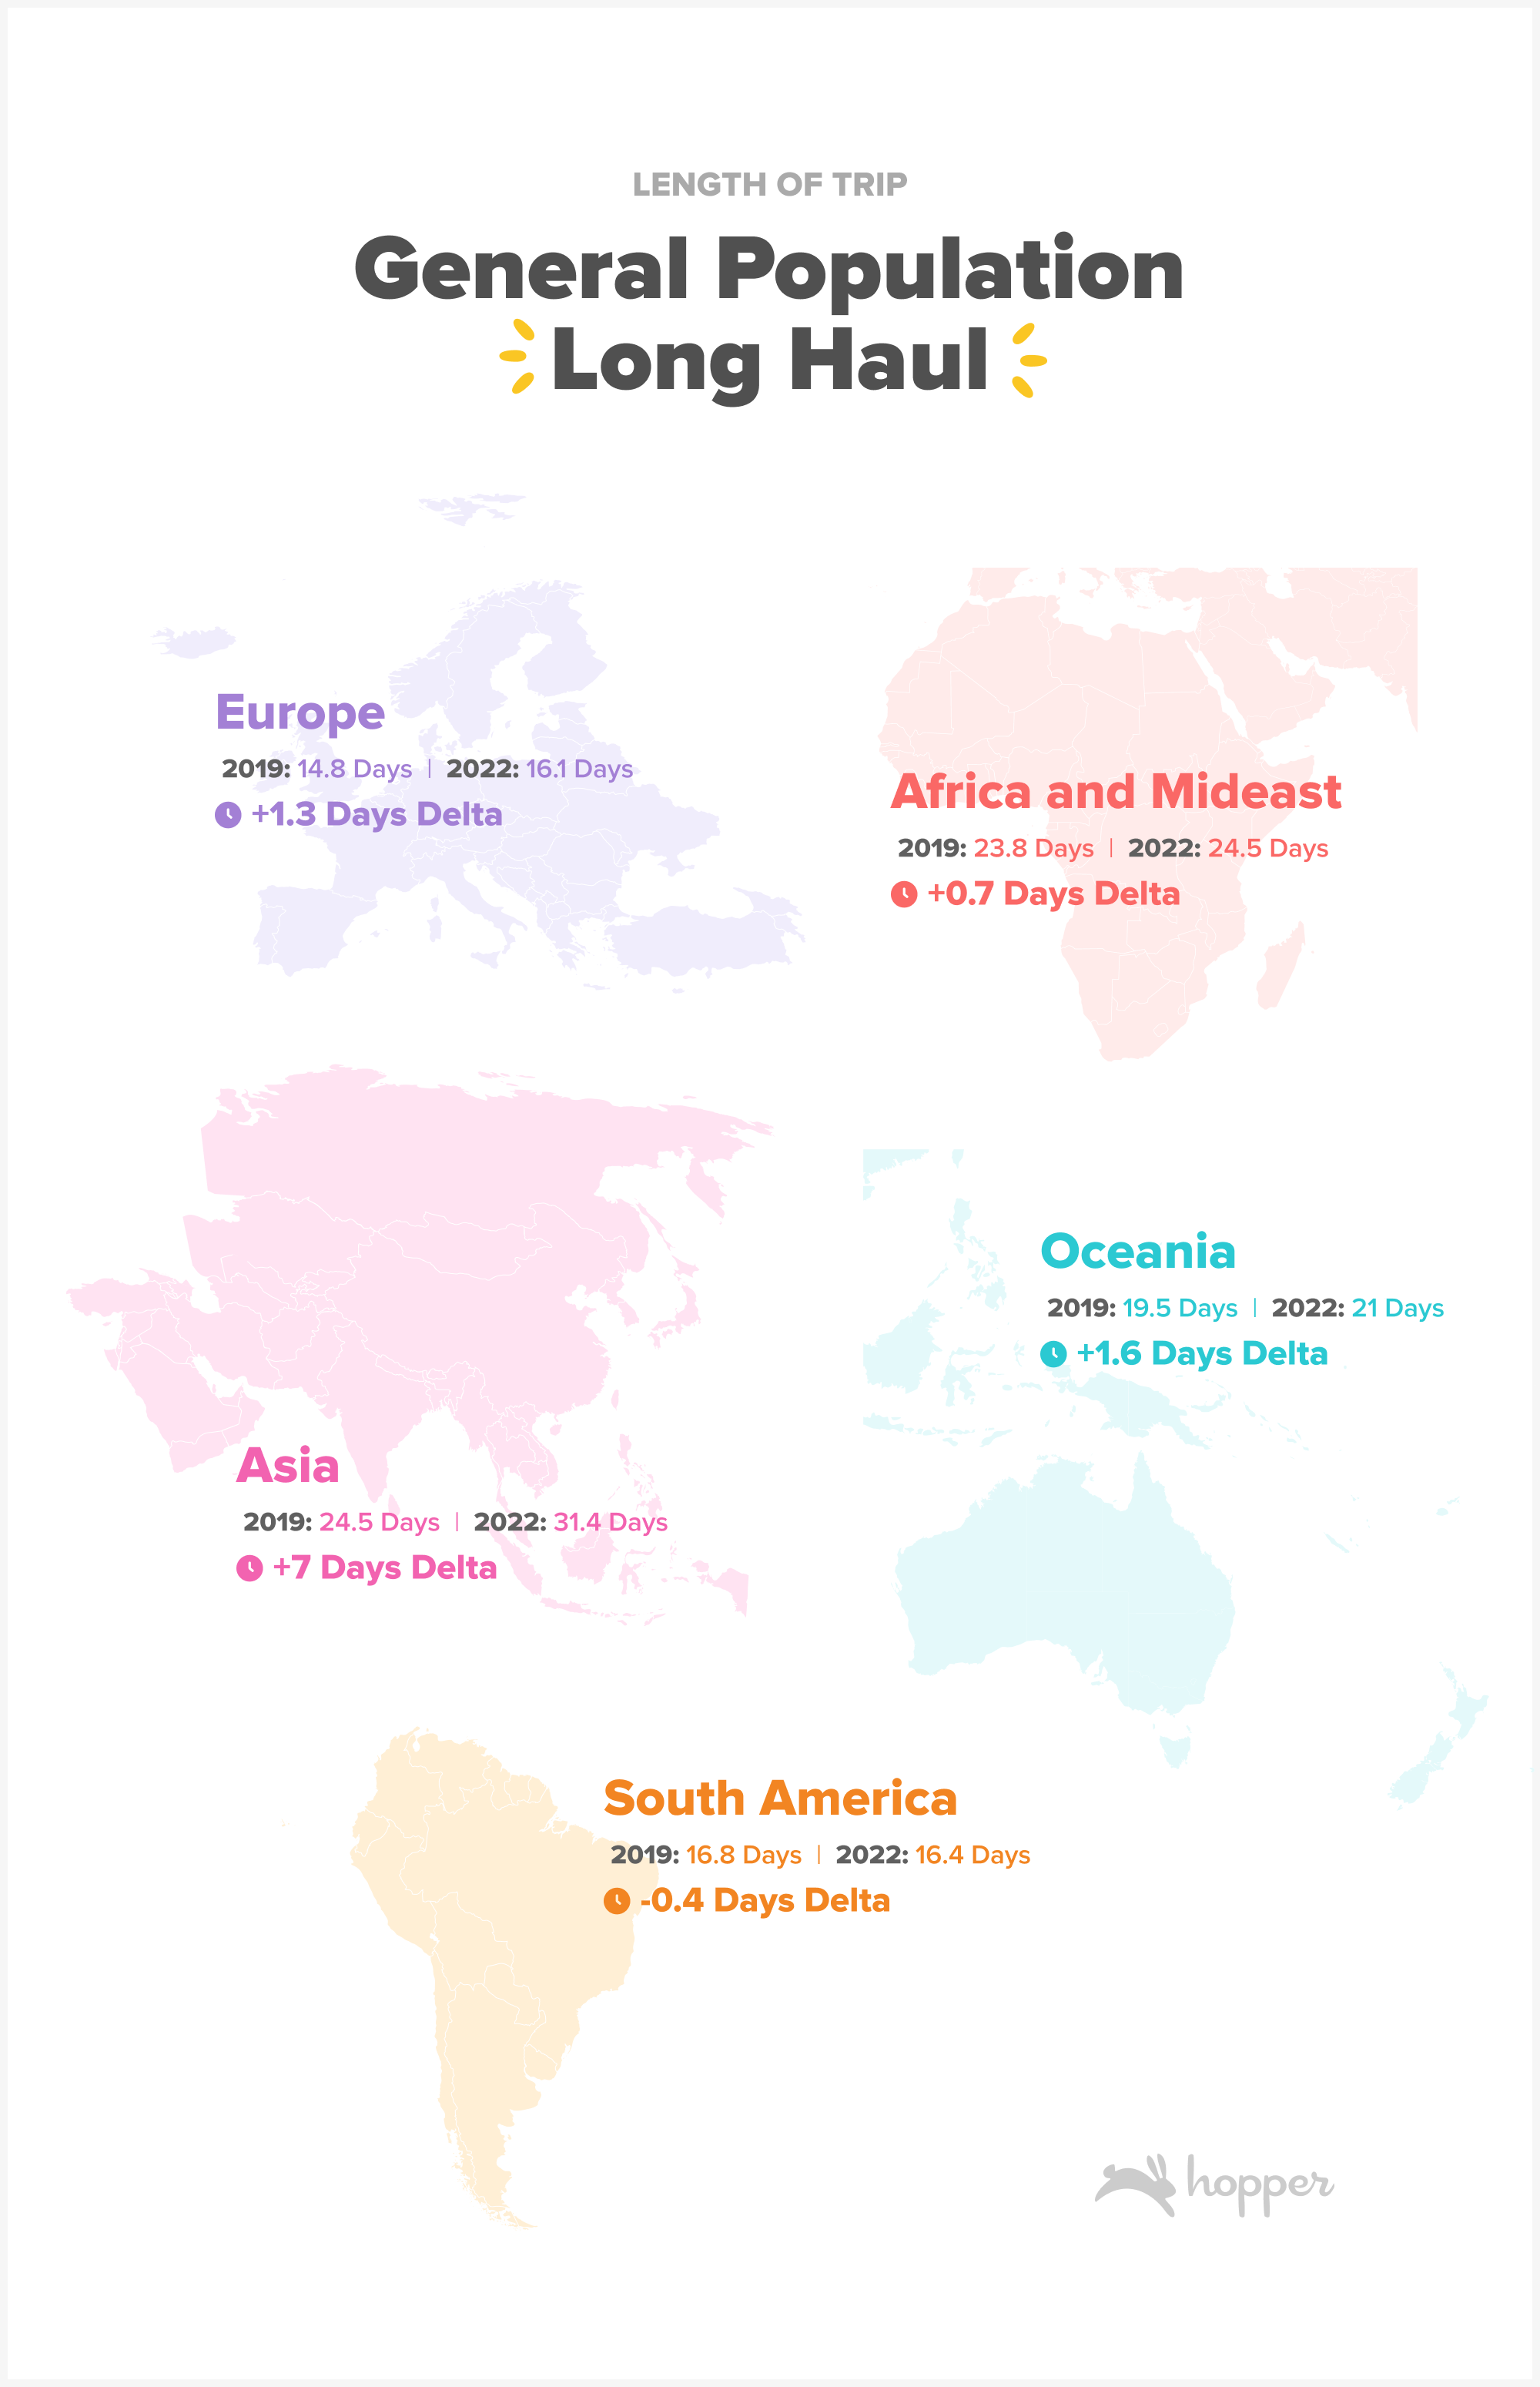
Travel to further flung destinations outside of North and Central America has increased in length compared to pre-pandemic, by as much as a week. Travel to Asia has increased in length by 7 days on average, bringing trips to an average of nearly 32 days as the destination surges with demand. Trips to Europe, Oceania, Africa and the Mideast are also benefiting from the addition of ~1+ days per trip on average in the last year.
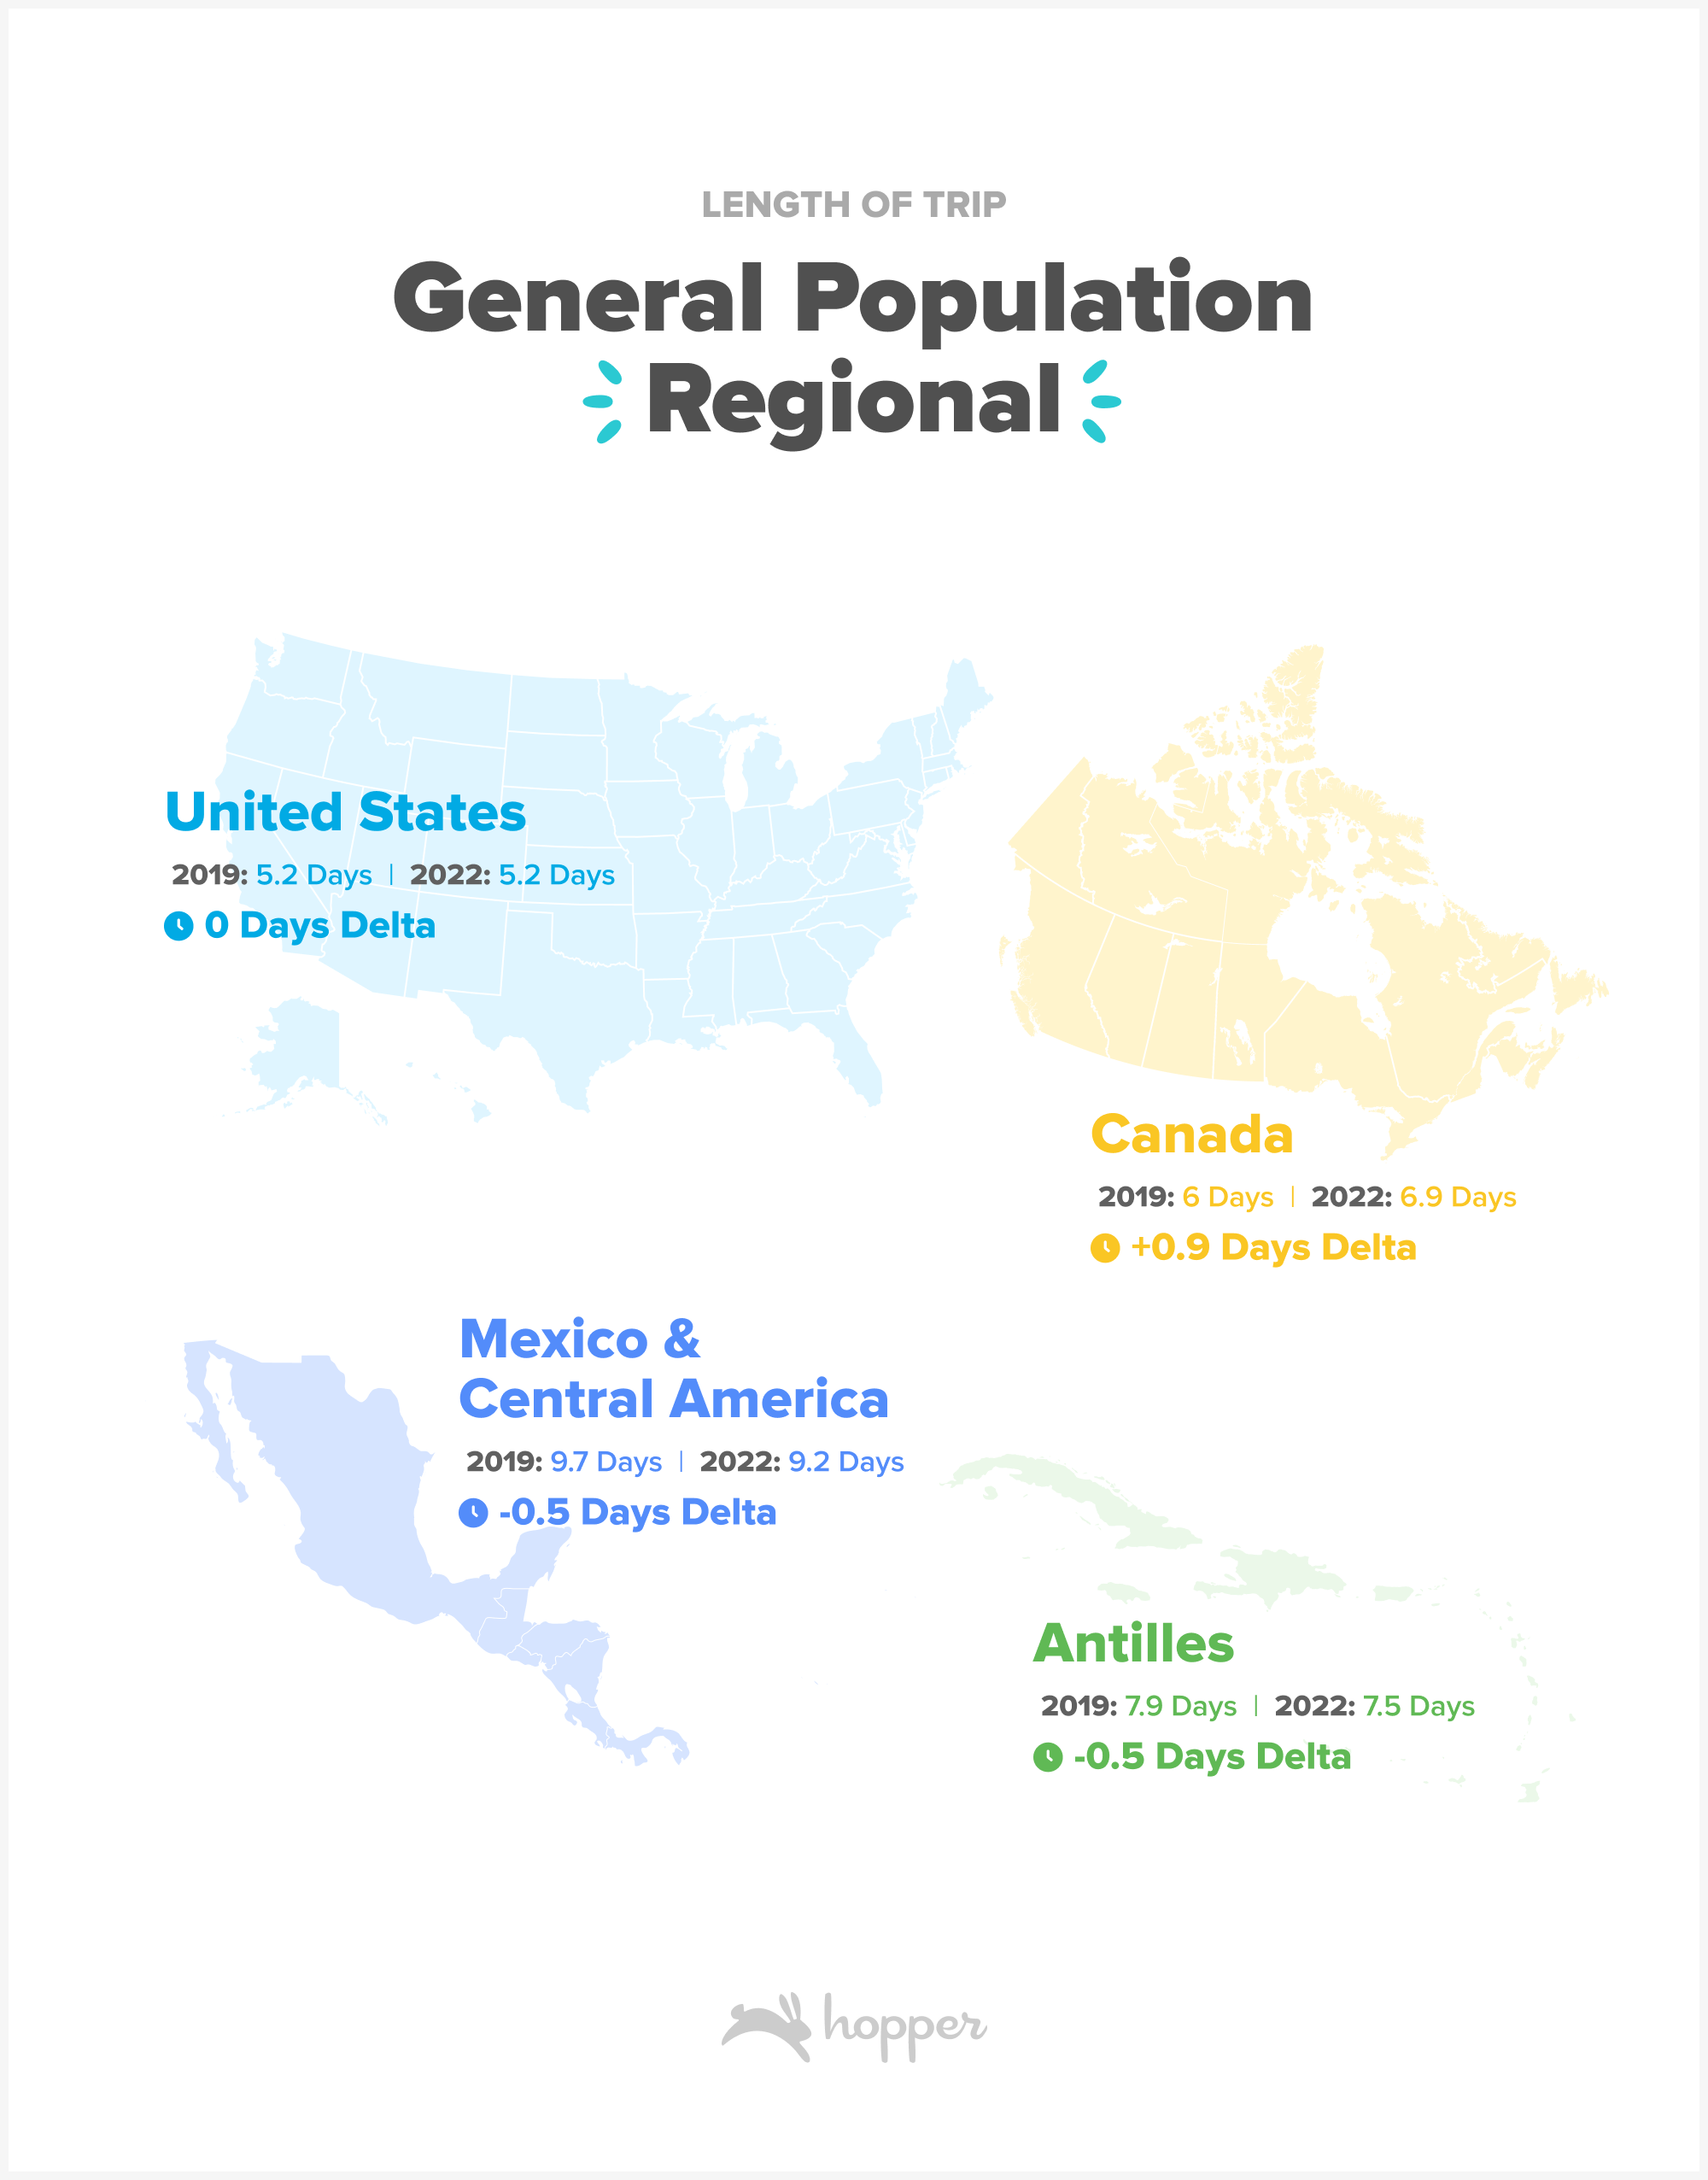
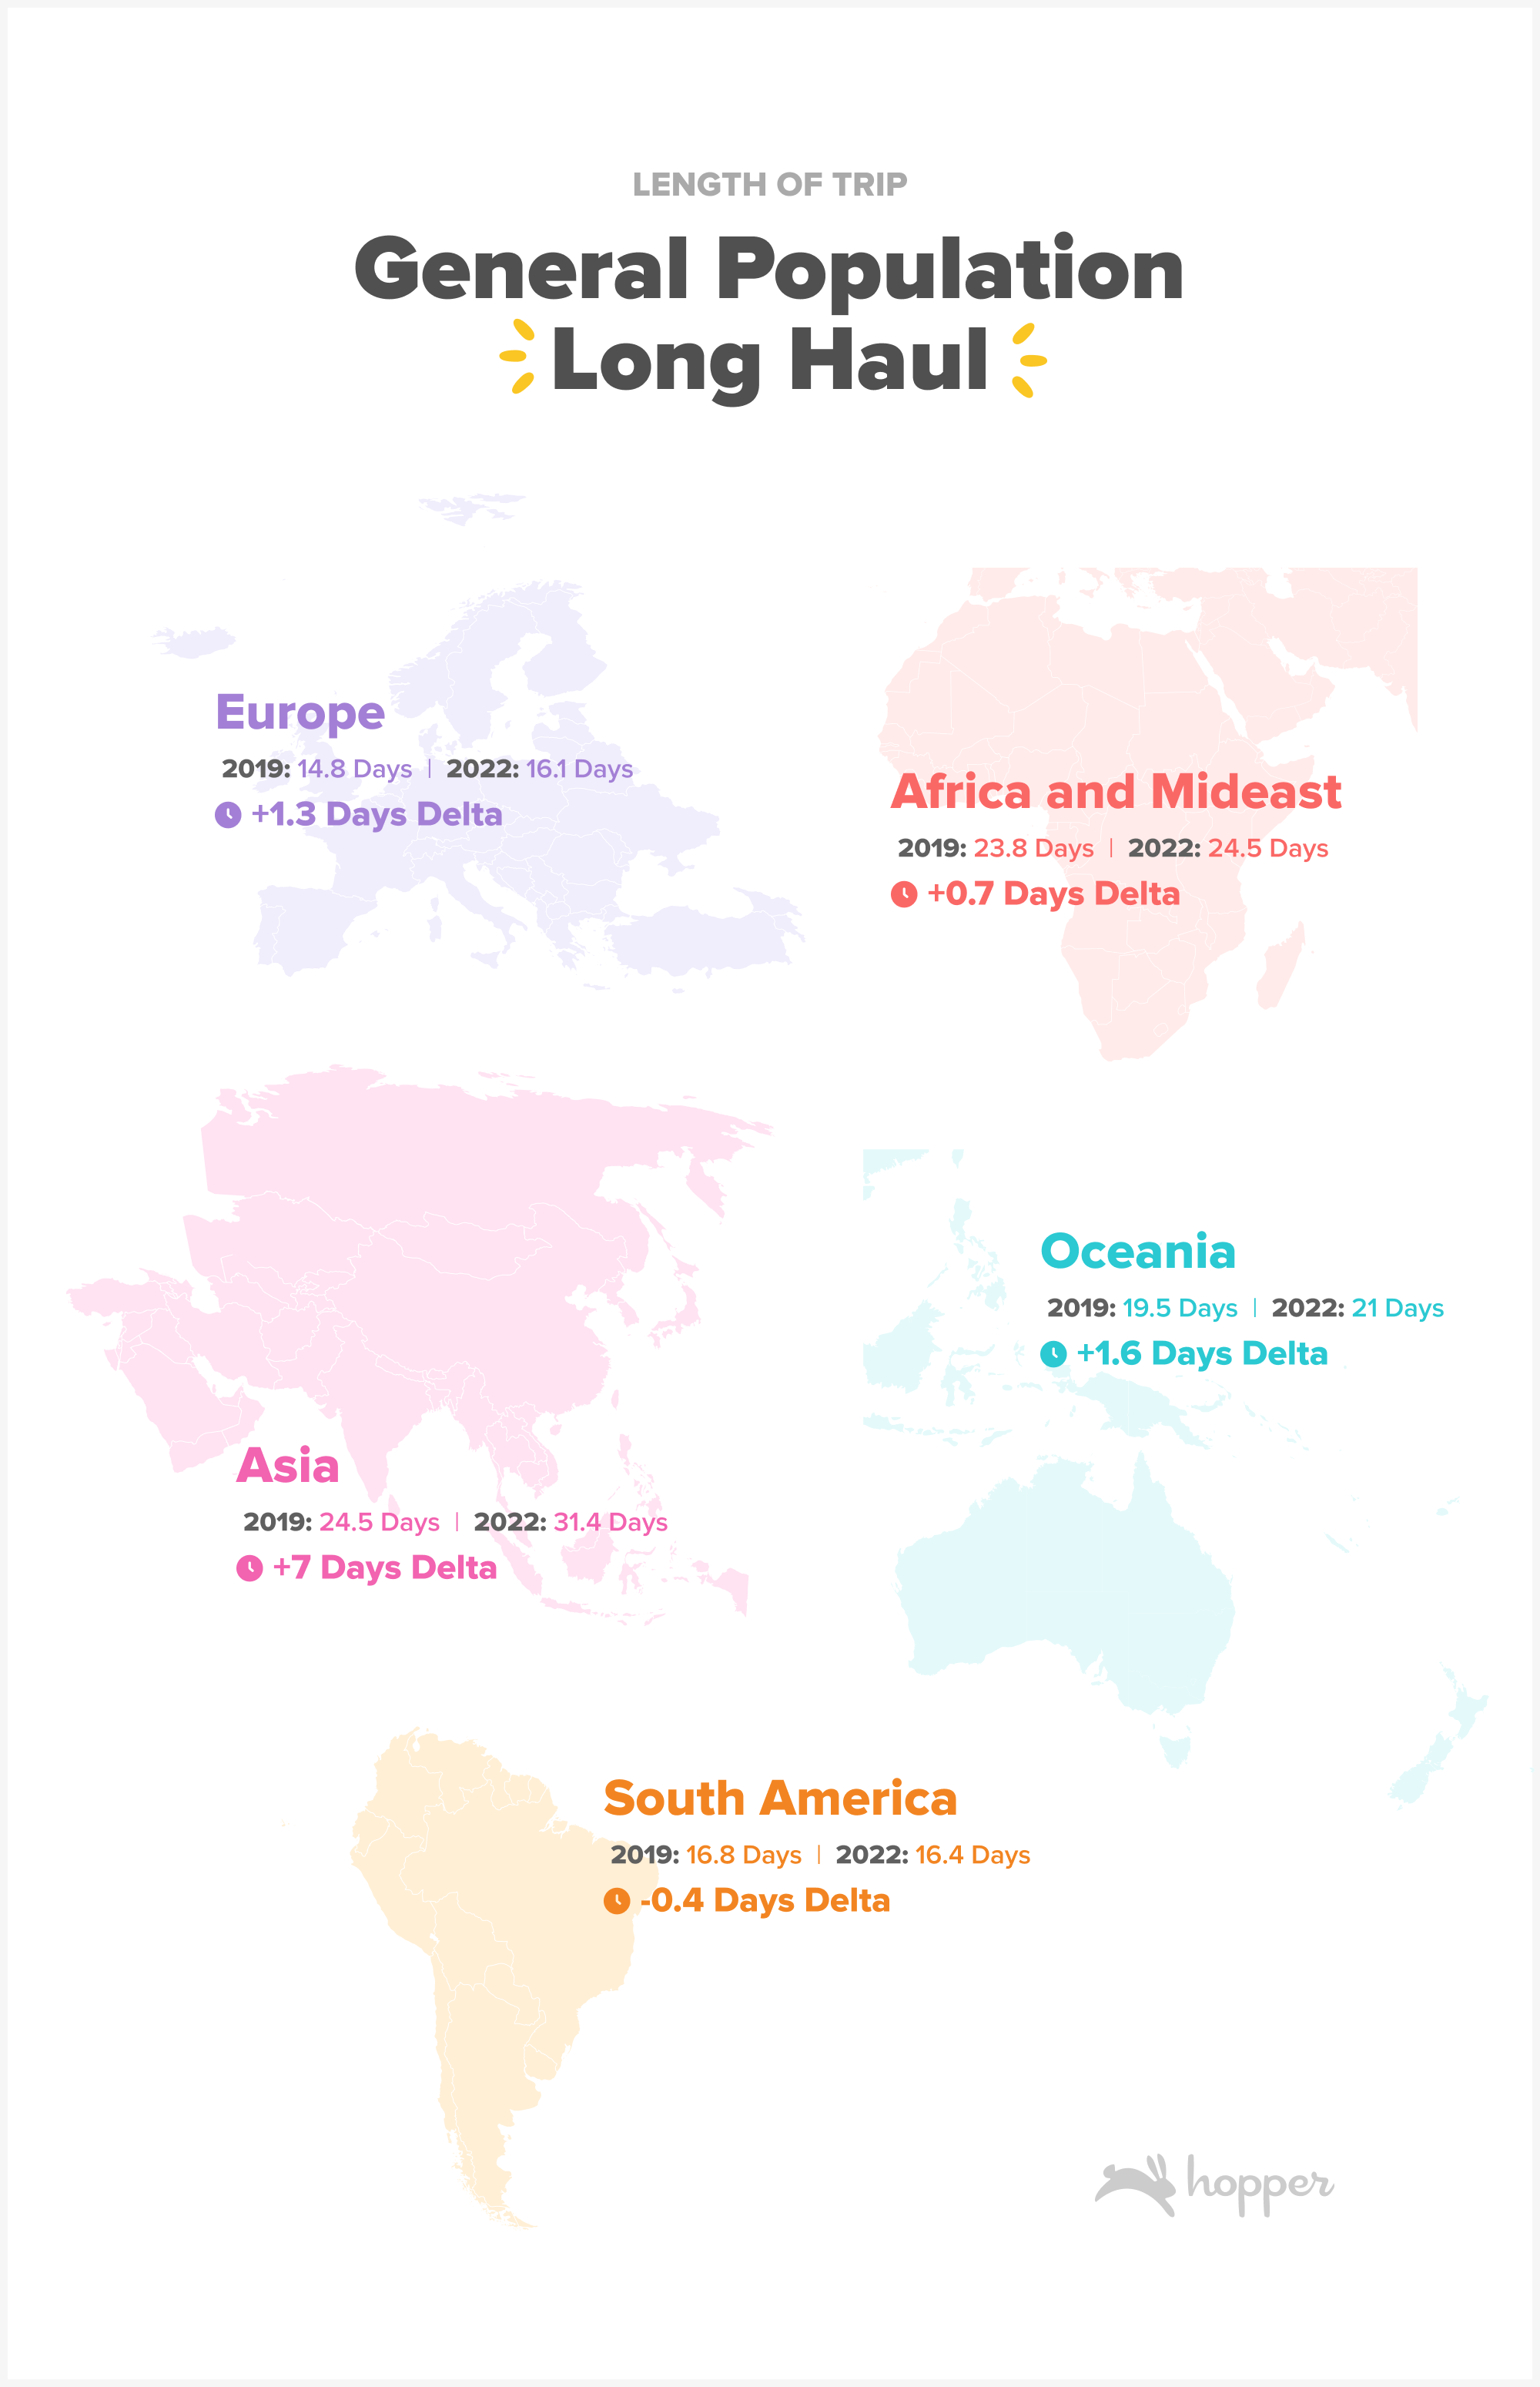
Figures: All populations represent the average length of stay for trips booked in 2019 and 2022 from MIDT.
Millennials & Gen Z expanding long haul travel even more.
As Hopper is a mobile travel app, bookings skew towards Millennial and Gen Z customers which gives us unique insight into how these younger travelers are booking differently than the rest of the population.
Hopper’s bookers truncated trips to all destinations except Asia, Europe and Africa/Mideast in 2022 compared to pre-pandemic trip lengths. Regional trips outside the U.S were shortened by a day or more per trip, while trips to Oceania dropped in length by as much as 3.4 days on average.
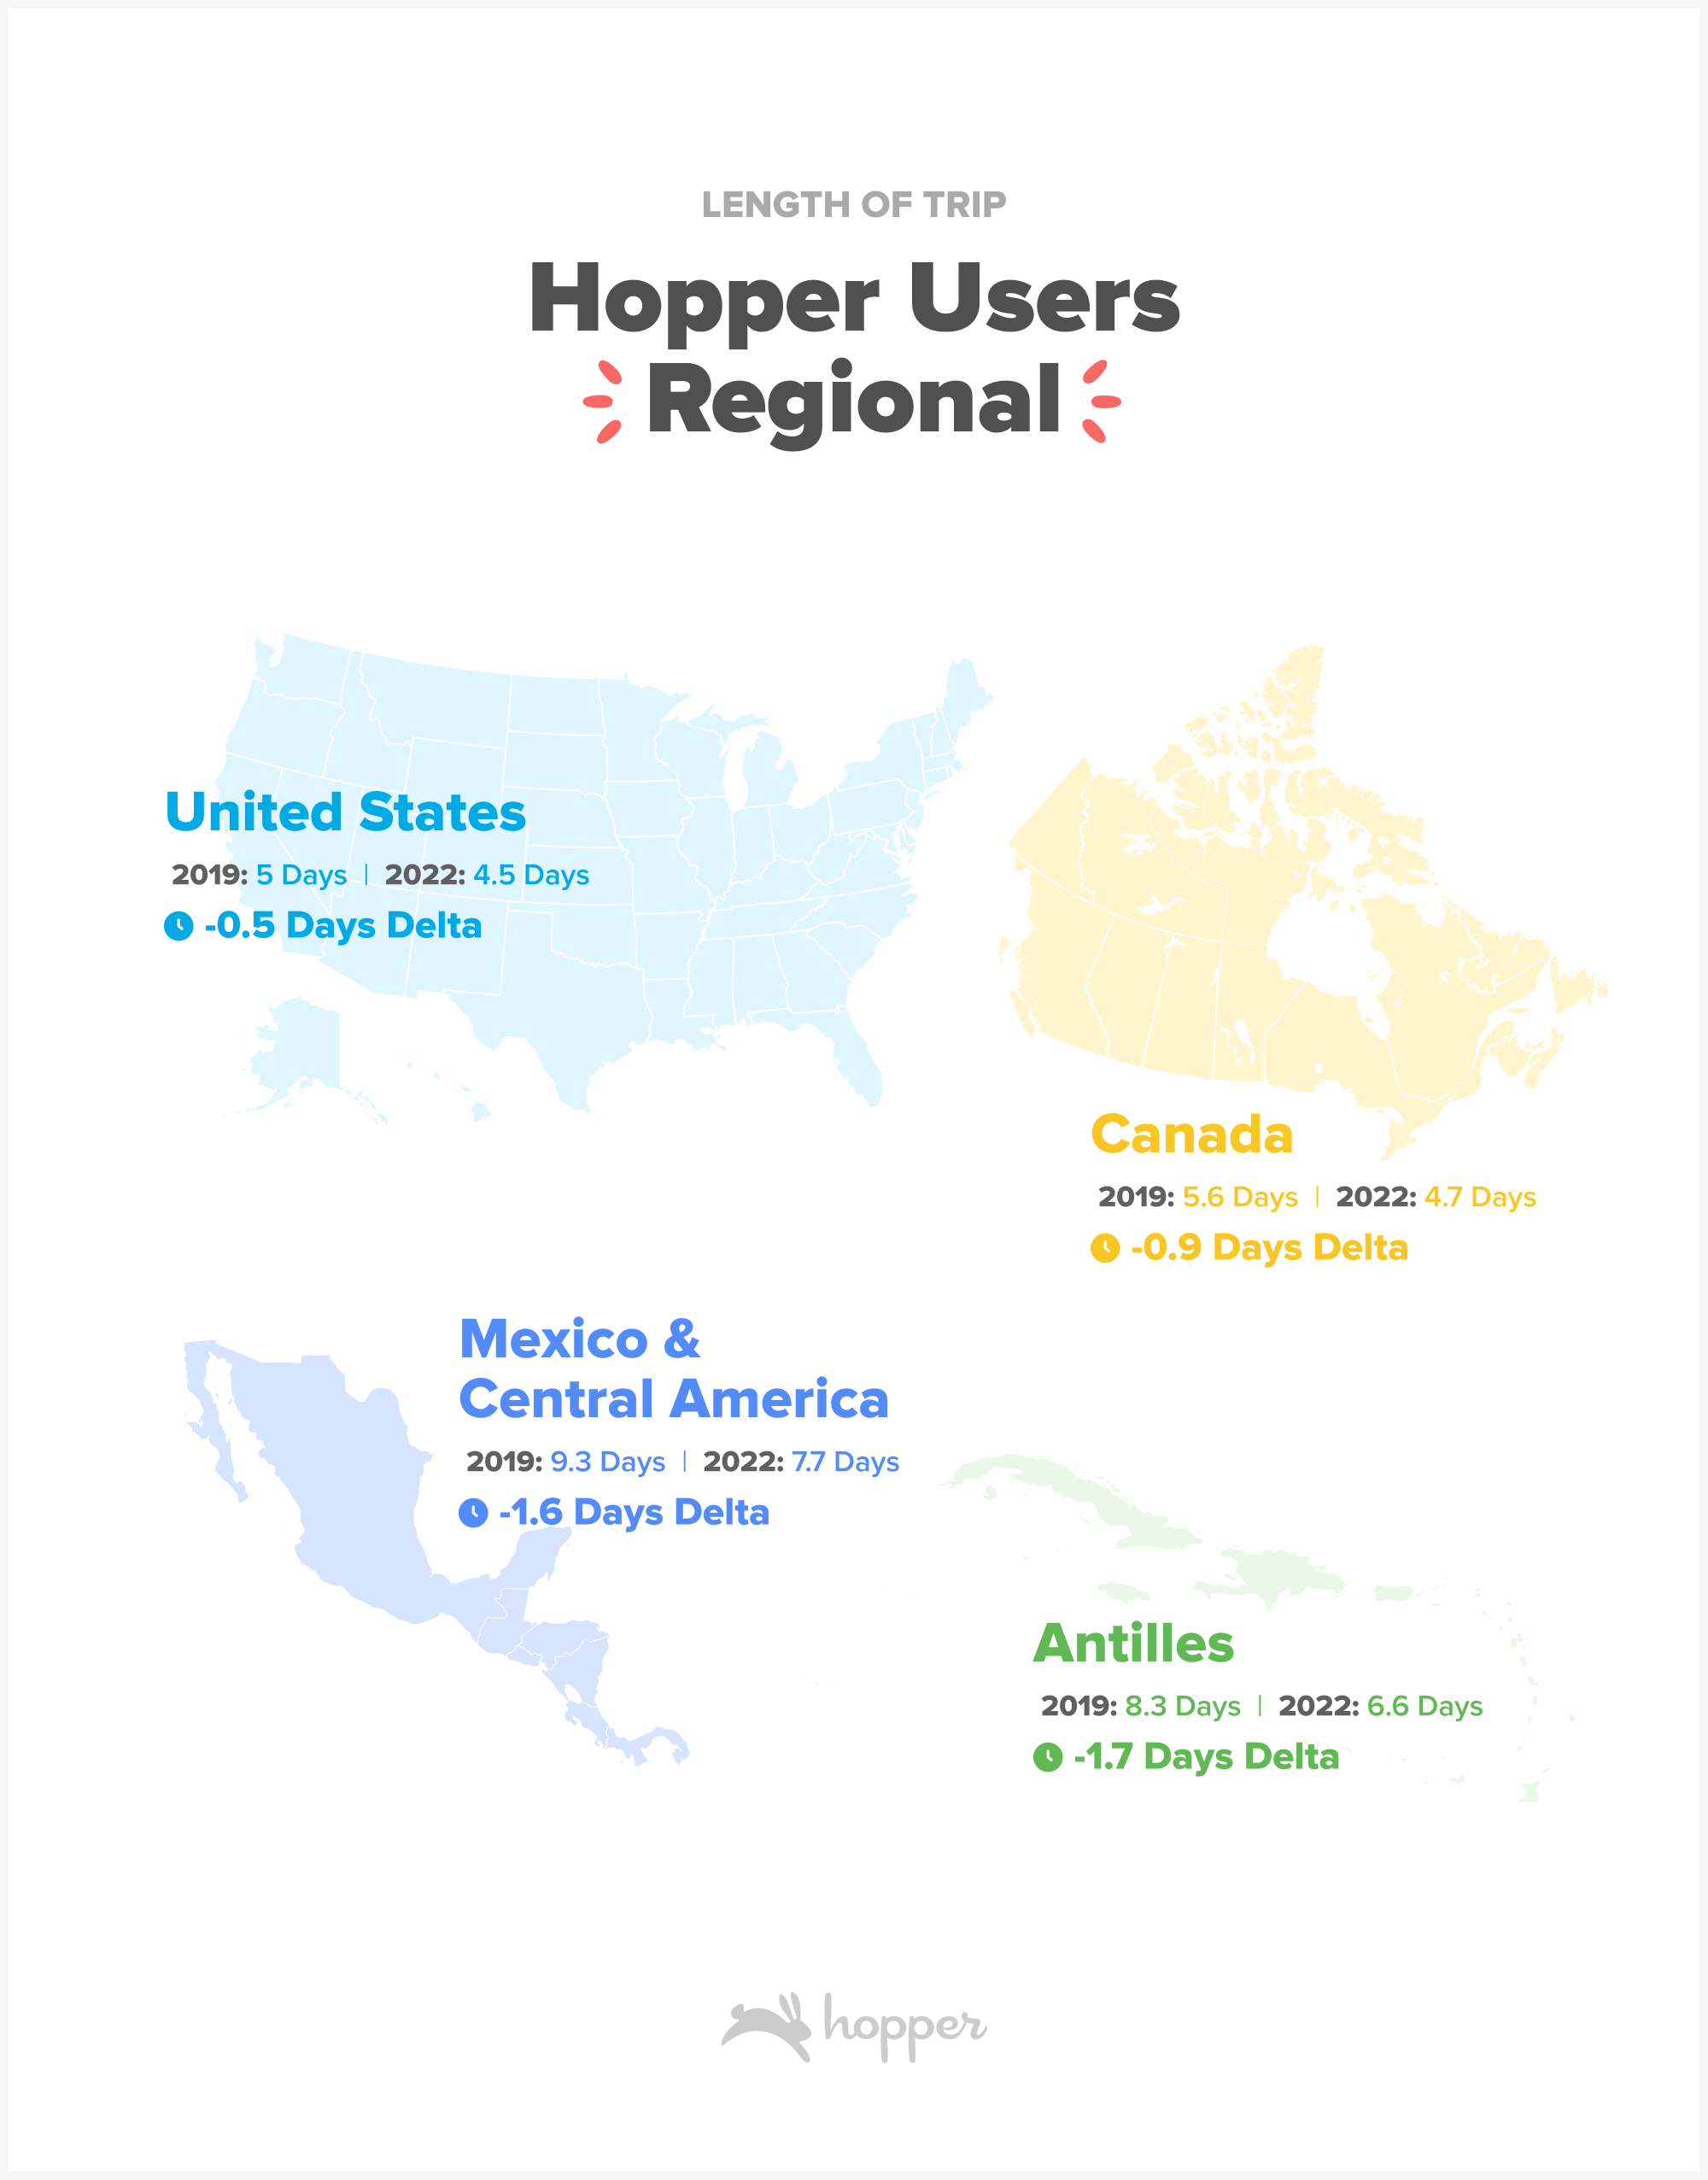
Figures: Millennial/GenZ represents average length of stay for trips booked on the Hopper app in the same period.
Domestic trips for Hopper bookers in 2022 were 10% shorter on average than trips booked in 2019, going from an average of 5 days per trip to 4.5 days. However, signals for 2023 are already showing a rebound in trip length from 2022 lows, which could signal there is still room for trips to recover back to pre-pandemic lengths.

Figure: Average length of stay for trips booked on the Hopper app based on departure date in 2019, 2022 and 2023 elapsed.
Trips to many regions worldwide have also been truncated in the last year, with the most notable drop in trip length to South America which shortened by 21% last year compared to 2019. Trips to warm weather destinations in Mexico, Central America and the Antilles have also been truncated, with trips nearly 2 days (17%-20%) shorter on average.
Though trips within the Americas and Canada have shortened compared to pre-pandemic, the same is not true of trips to further flung destinations in Europe, Africa, Mideast and Asia. Trips from the U.S to Asia are averaging a full week longer than in 2019, up to a full 4 weeks from 3 weeks on average. Trips to Europe have expanded as well, with travelers tacking on an additional full day, bringing trips to the continent up to 2 weeks on average.
Travelers are taking more trips.
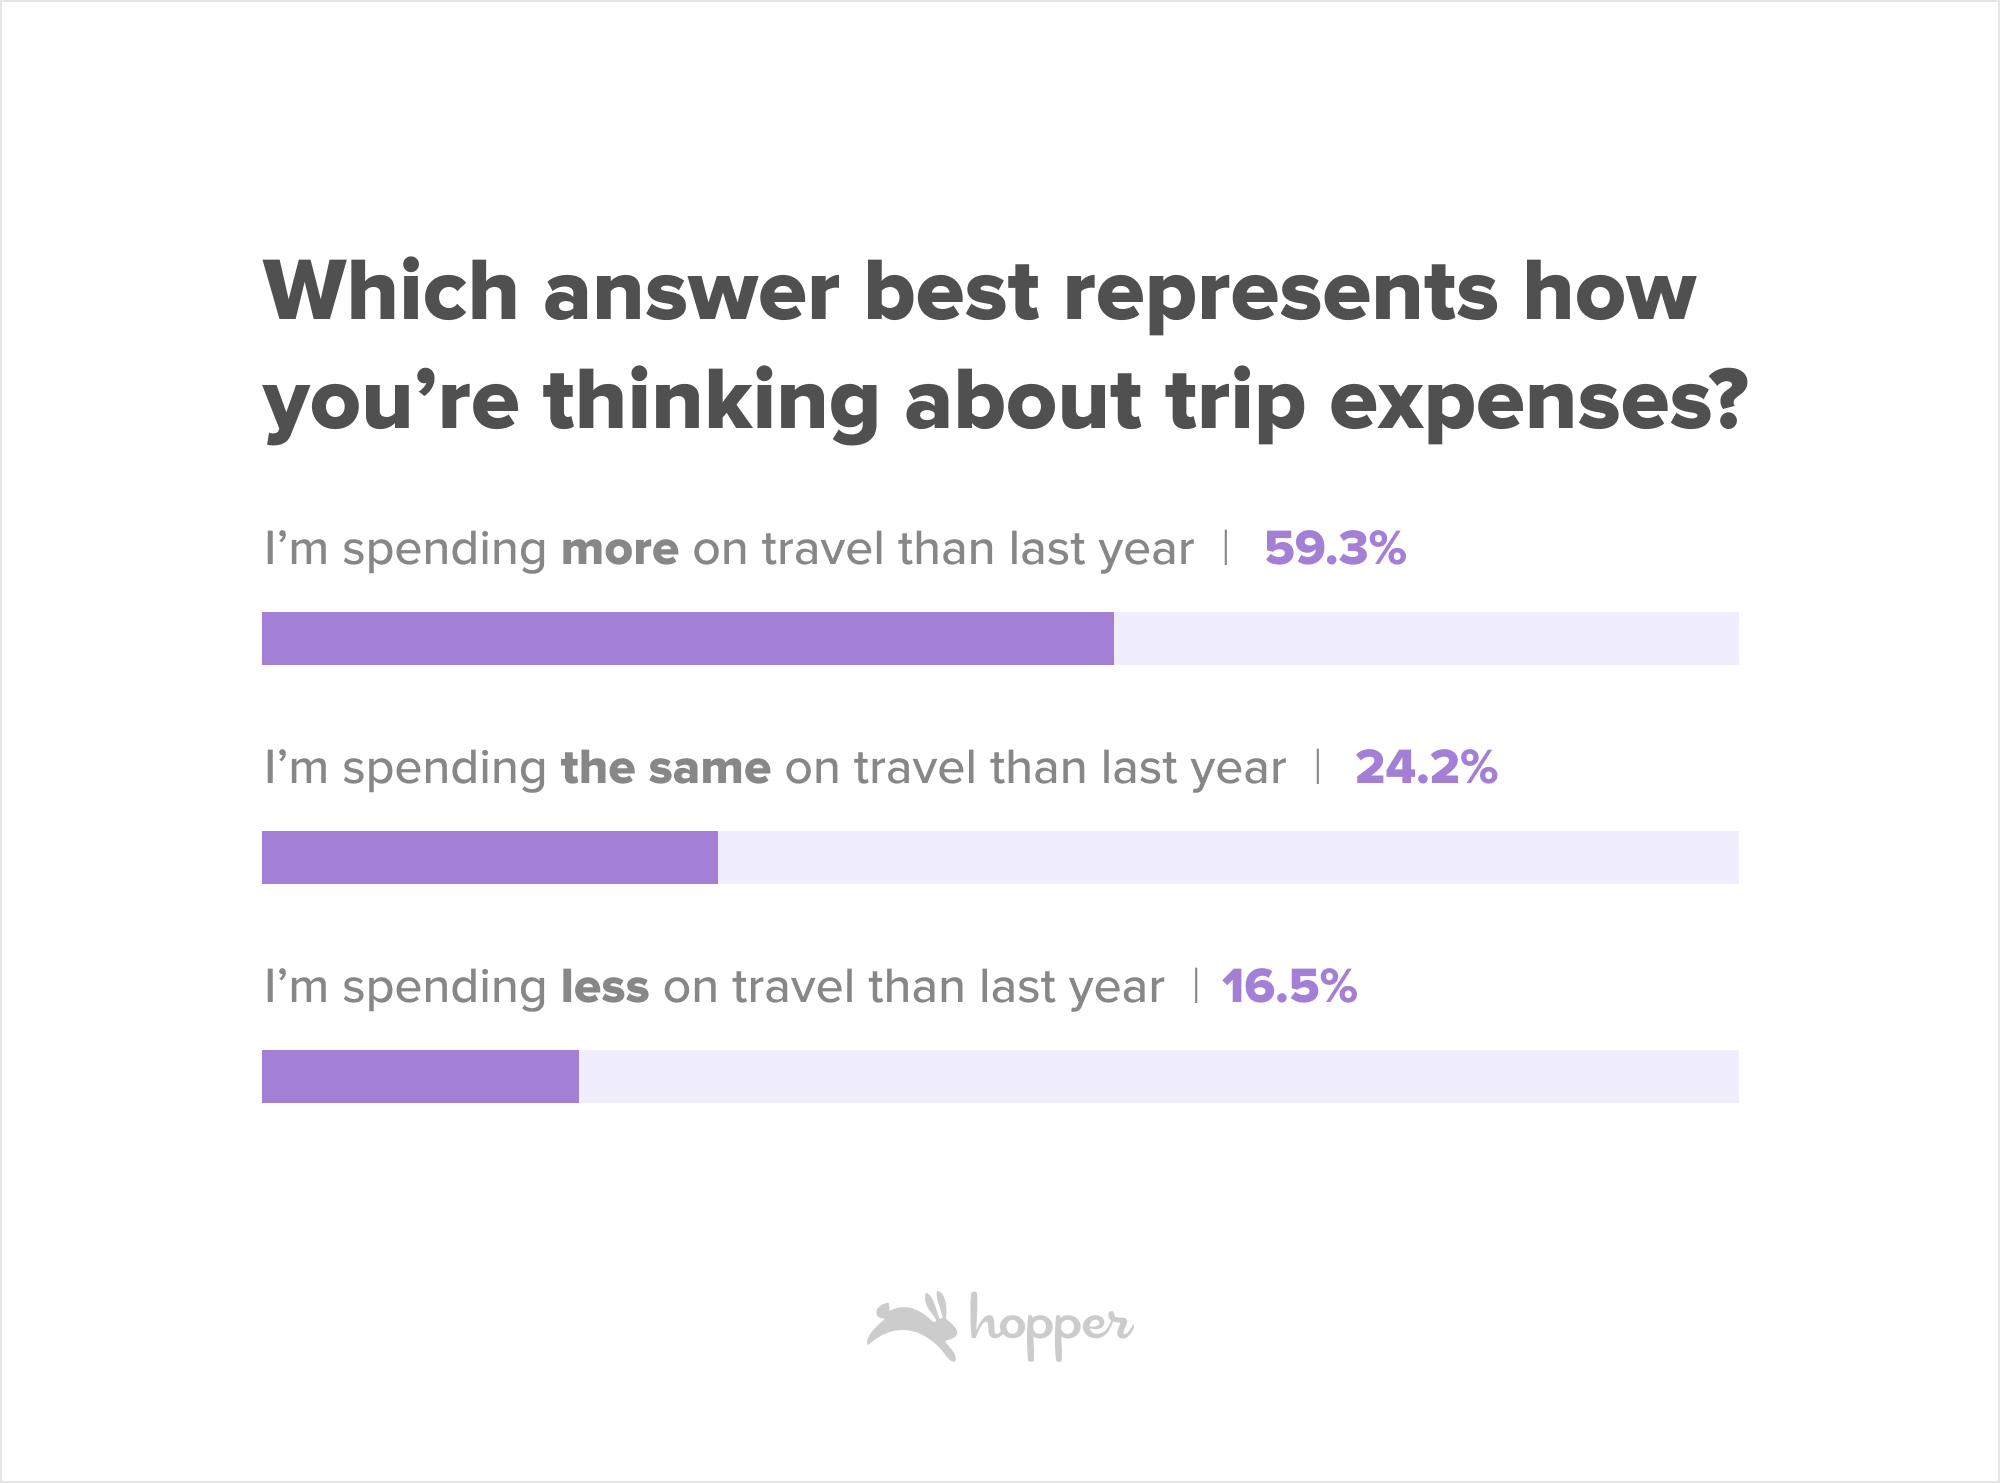
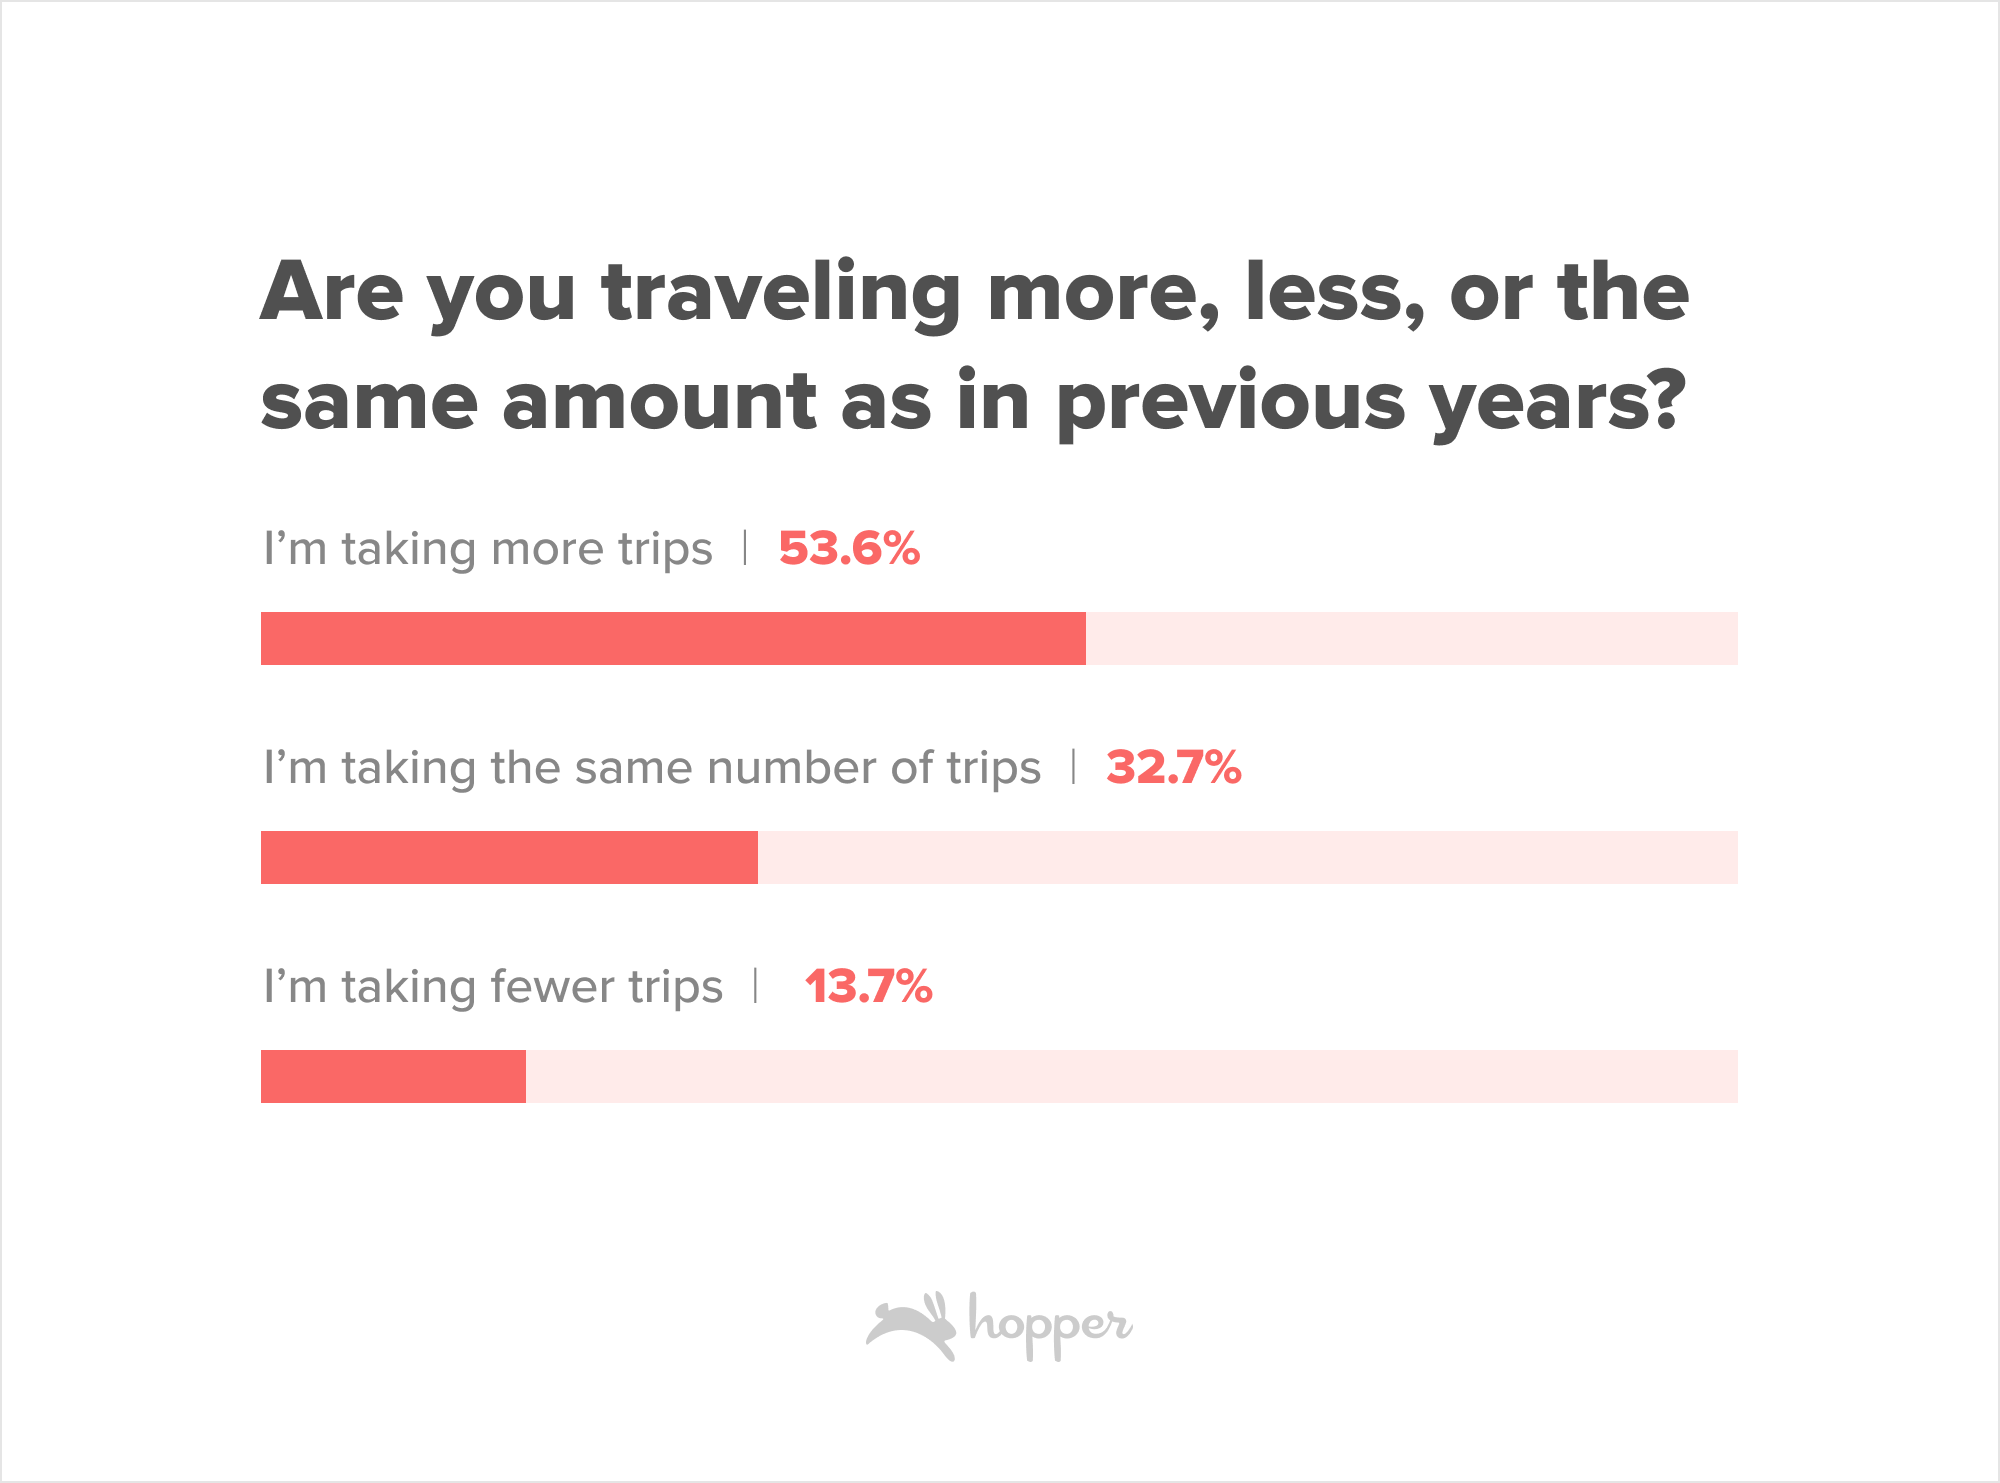
Despite economic concerns and inflation driving up costs, more than half of Hopper users claim they plan to take more trips this year than in previous years.
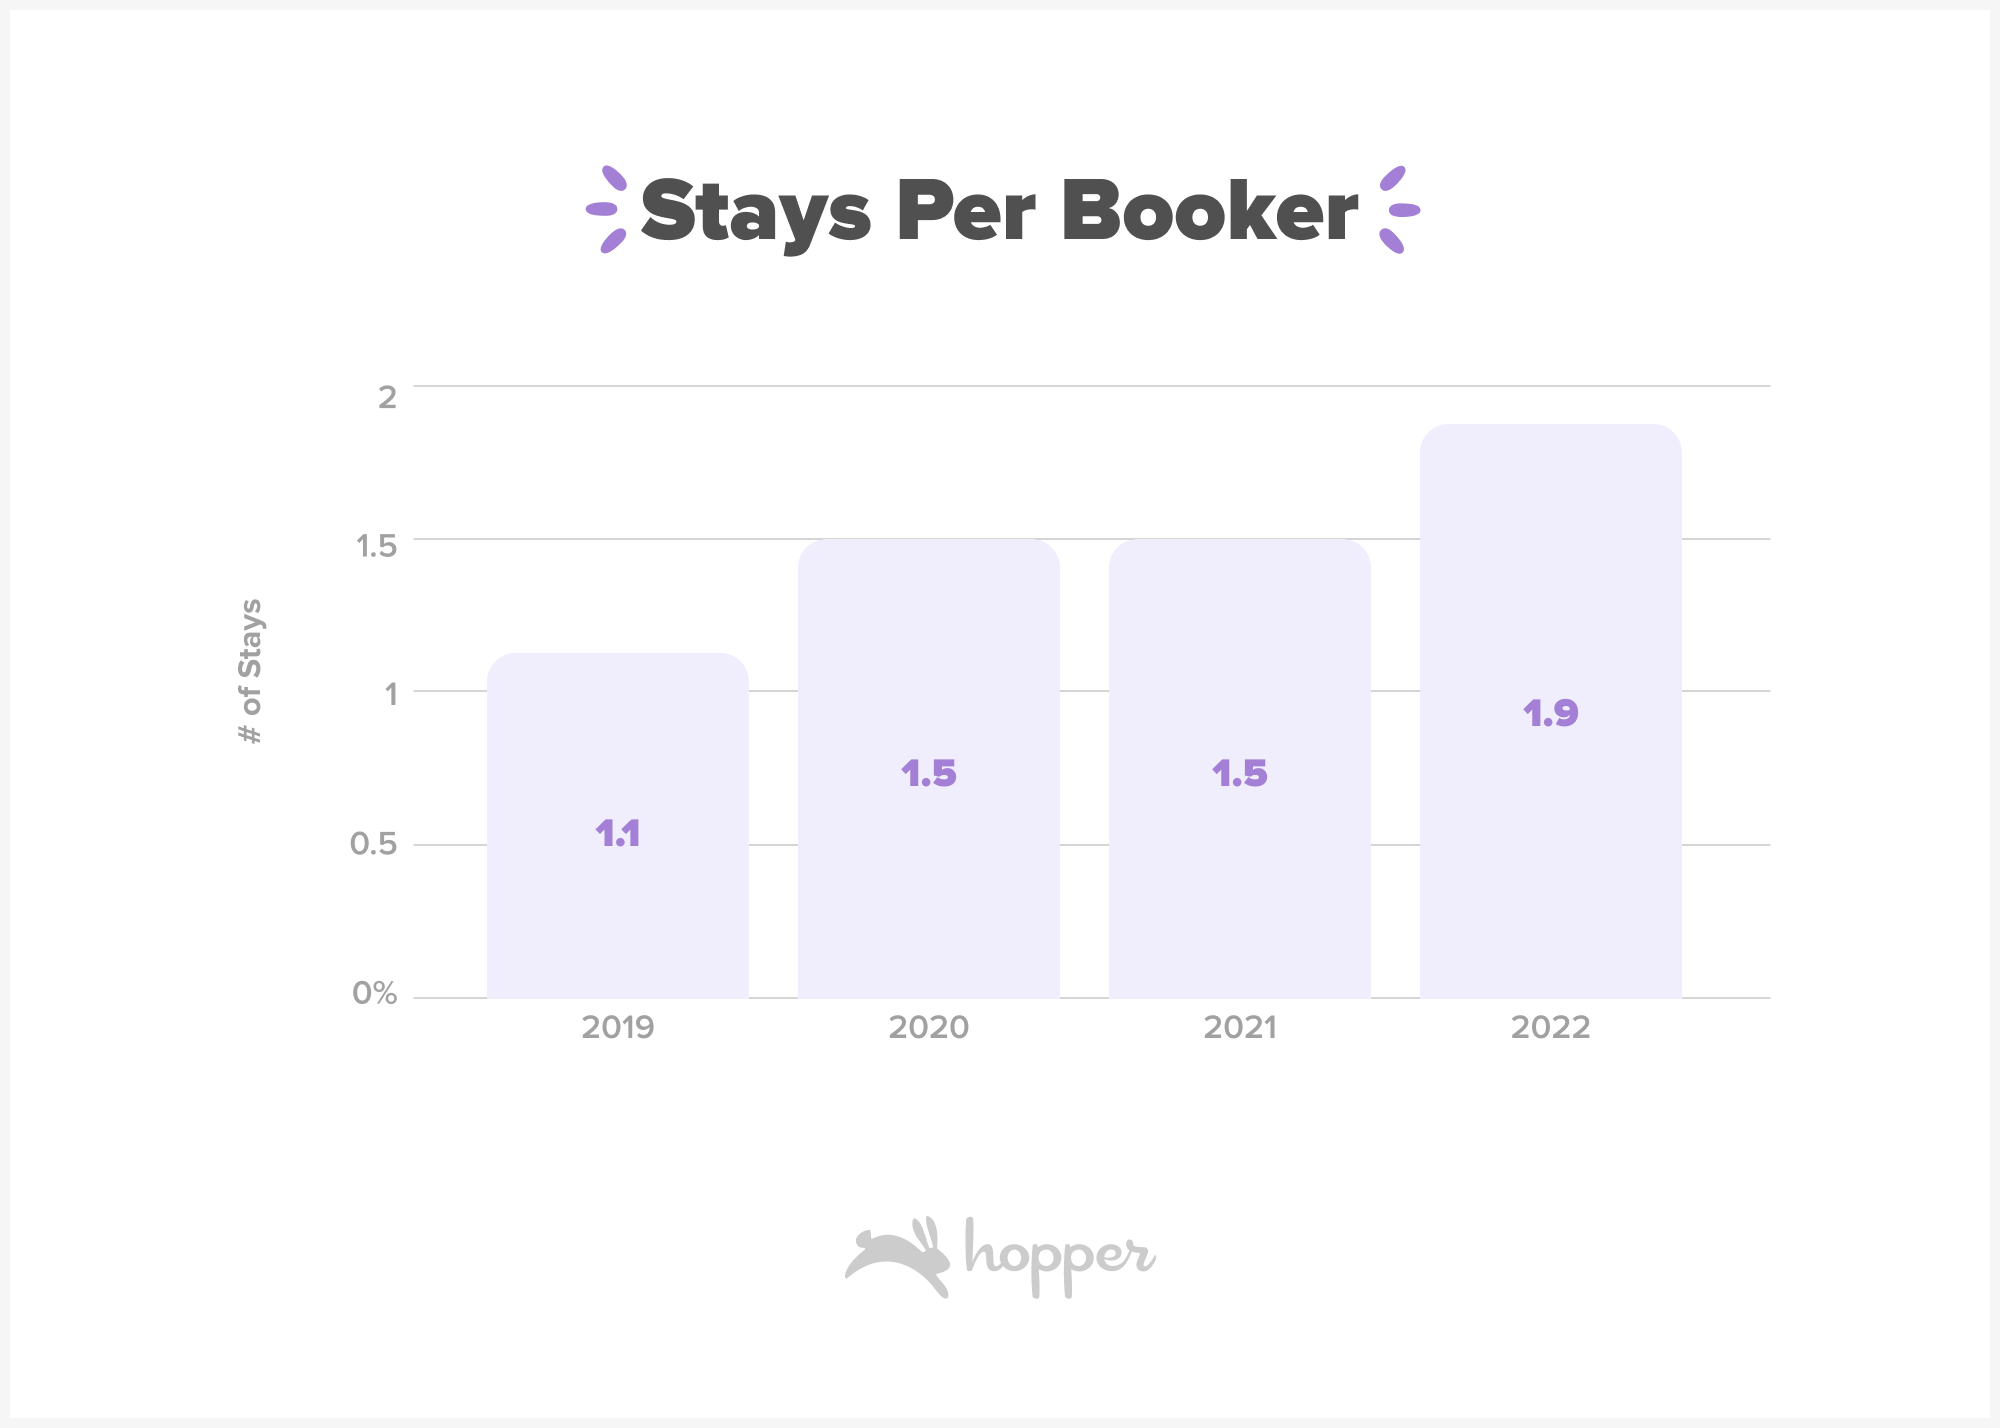
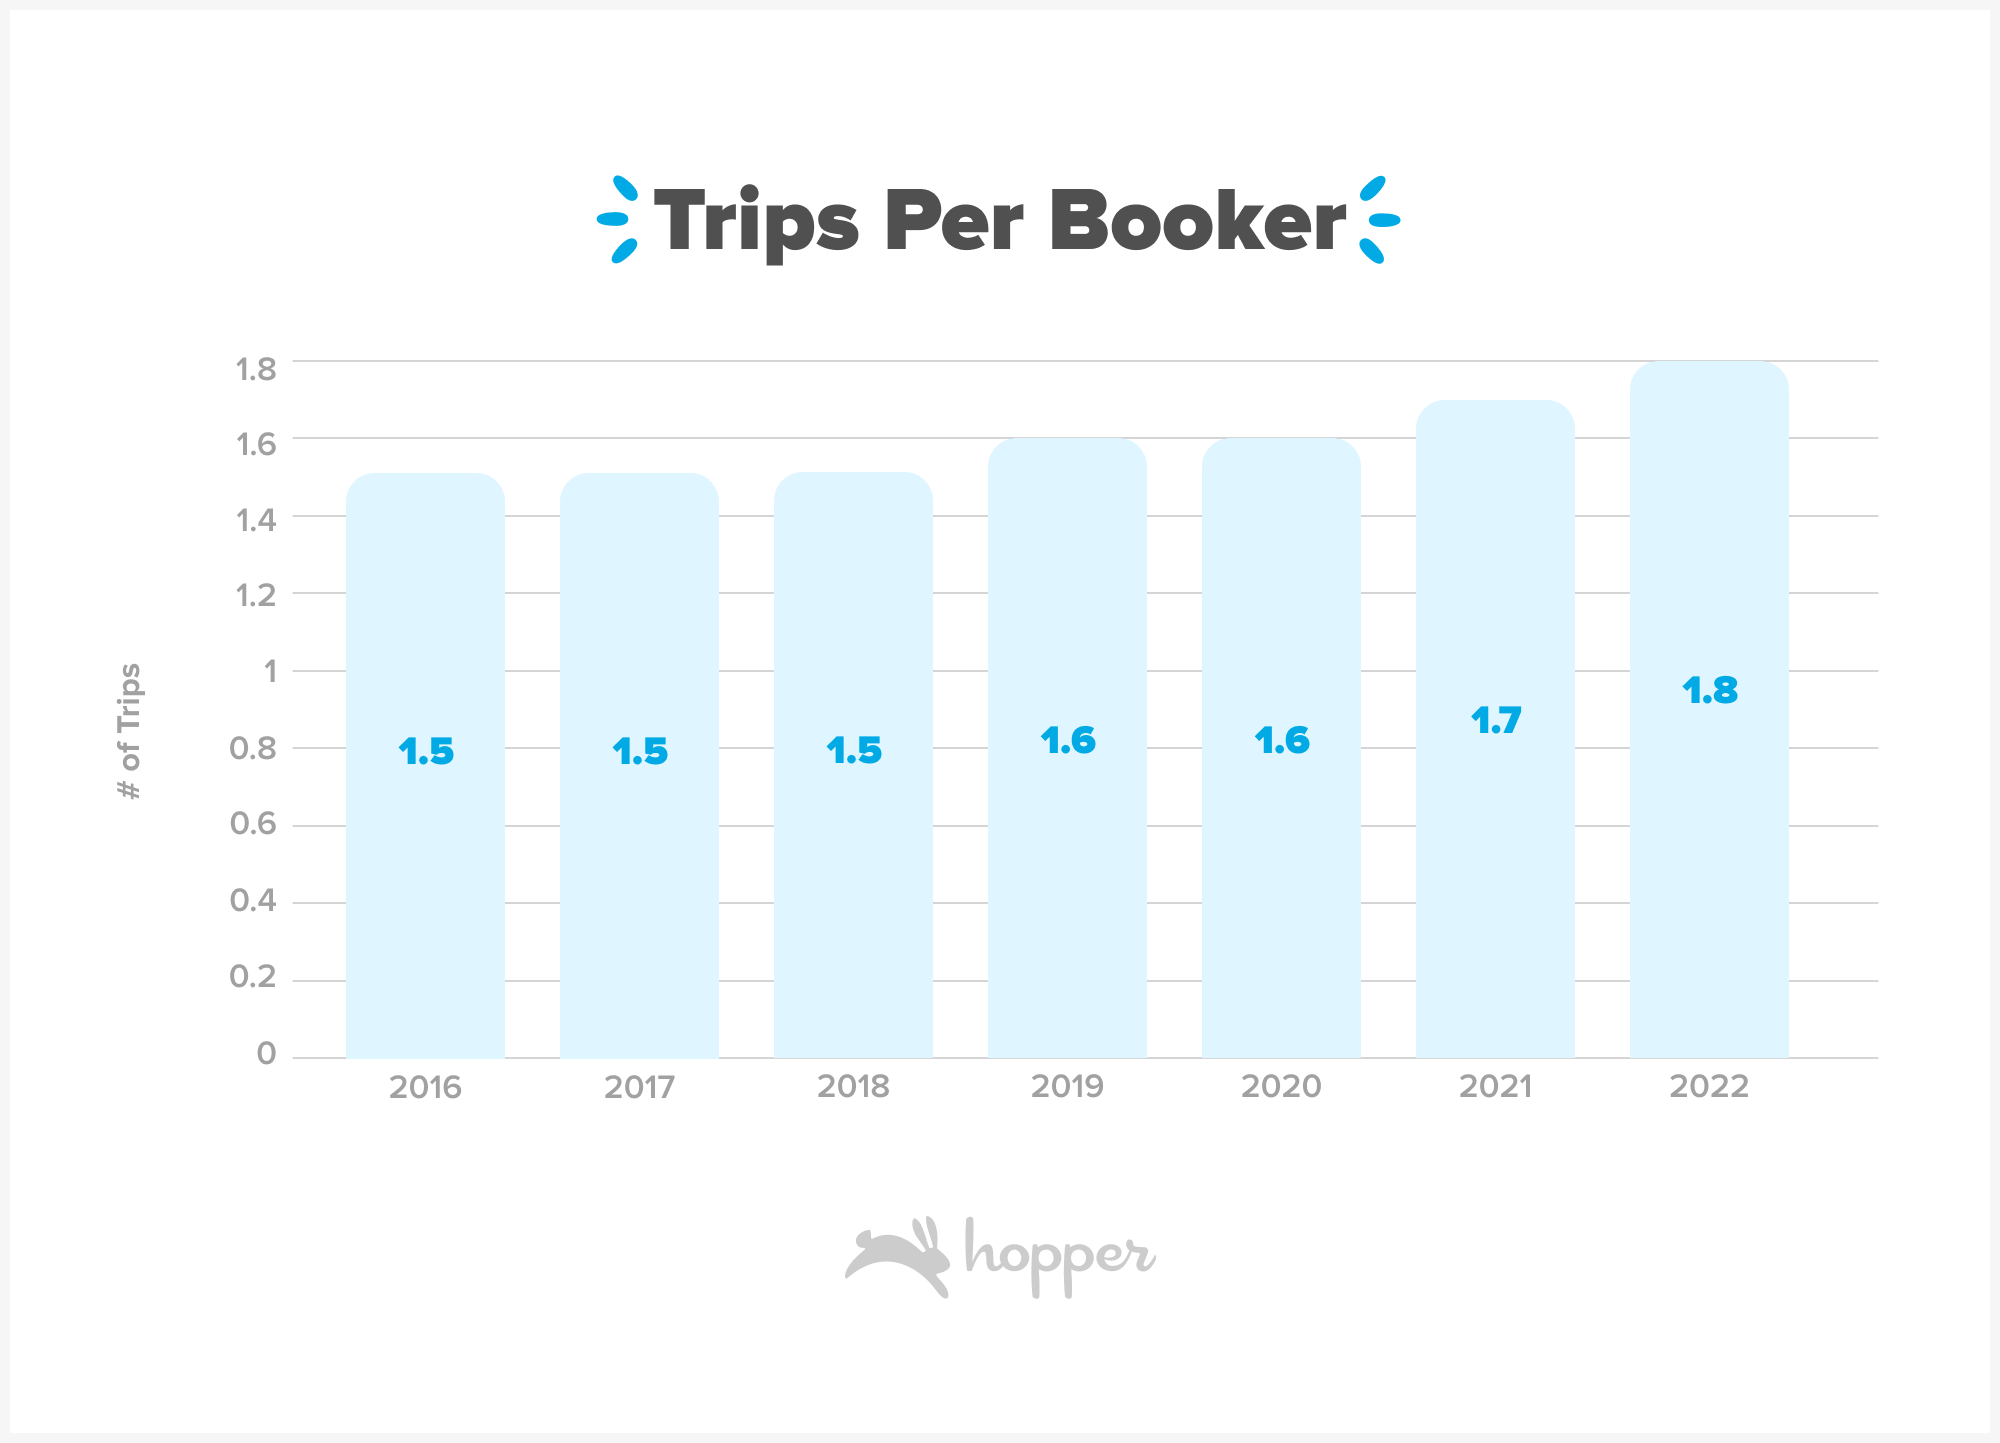
This is no surprise, given Hopper users are already booking more trips and stays than pre-pandemic. In 2022, Hopper users booked ~1.8 flights compared to just 1.5 pre-pandemic. Hotel bookers also planned more trips in 2022, averaging 2 hotel stays compared to just 1 stay per booker in 2019 when Hopper launched the Hotels offering.
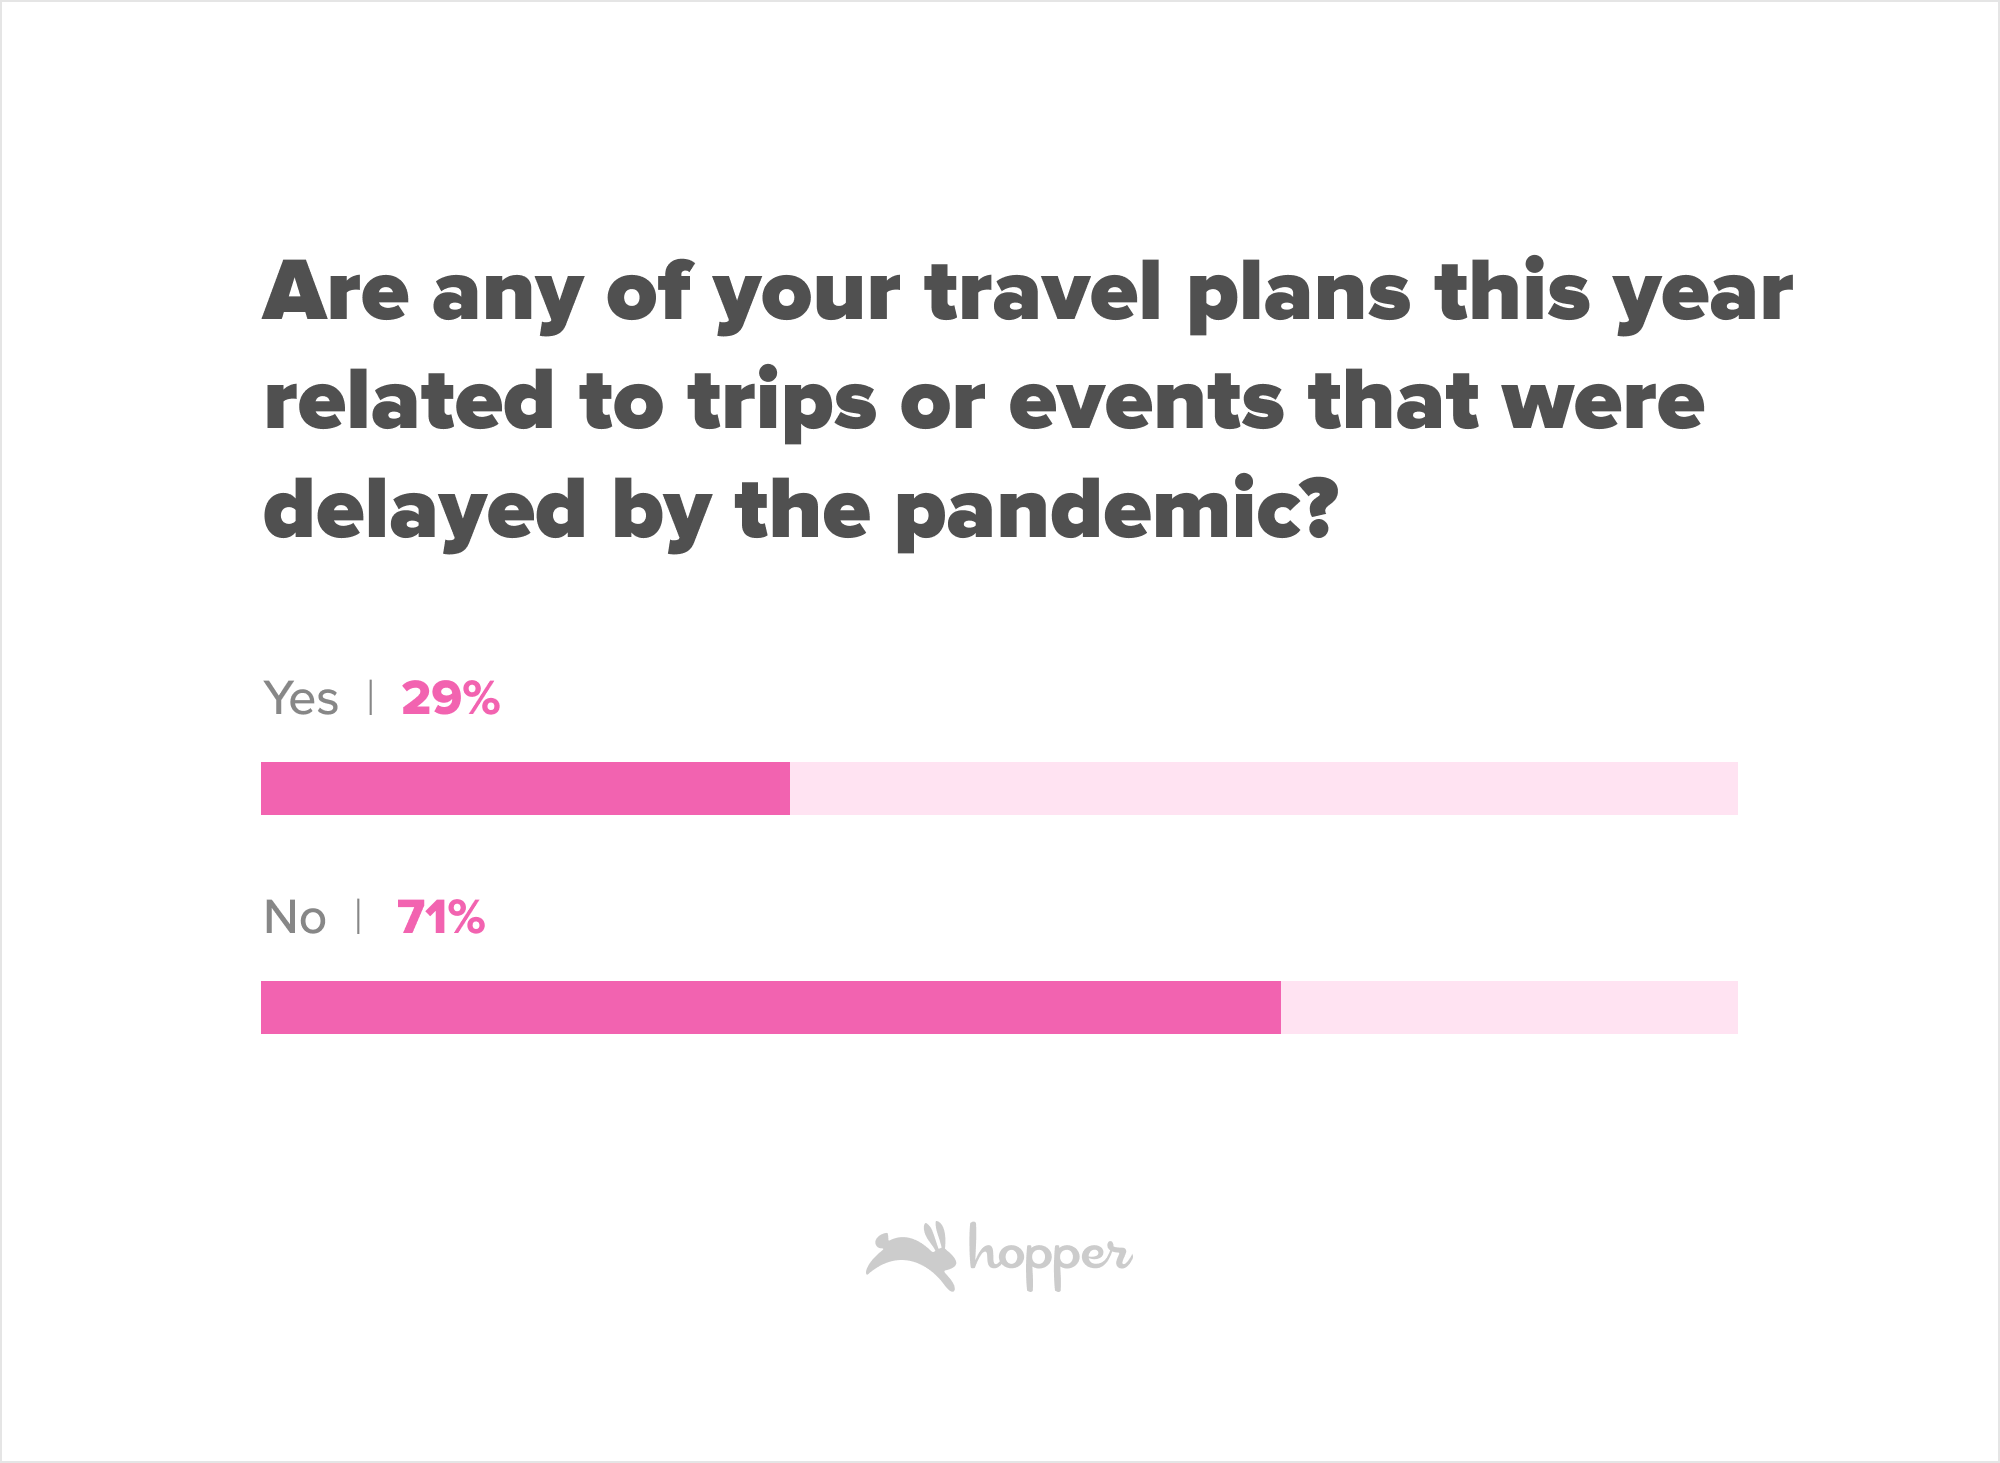
Though some of the additional trips may be for pandemic delayed events, only 30% of Hopper users are planning trips this year for events delayed by the pandemic. The remaining 70% of travelers are adding more trips to their schedule that span leisure vacations, visits to friends and family, events like weddings and sports games and much more.
Remote Work is Changing Modern Travel
Bleisure is the new Leisure
With the end of most travel restrictions worldwide, 2022 became the first year where millions of newly remote students and employees had the opportunity to take advantage of newly flexible schedules to travel worldwide. We asked Hopper users directly how remote flexibility has changed how they plan travel and the results were clear - Bleisure is the new Leisure!
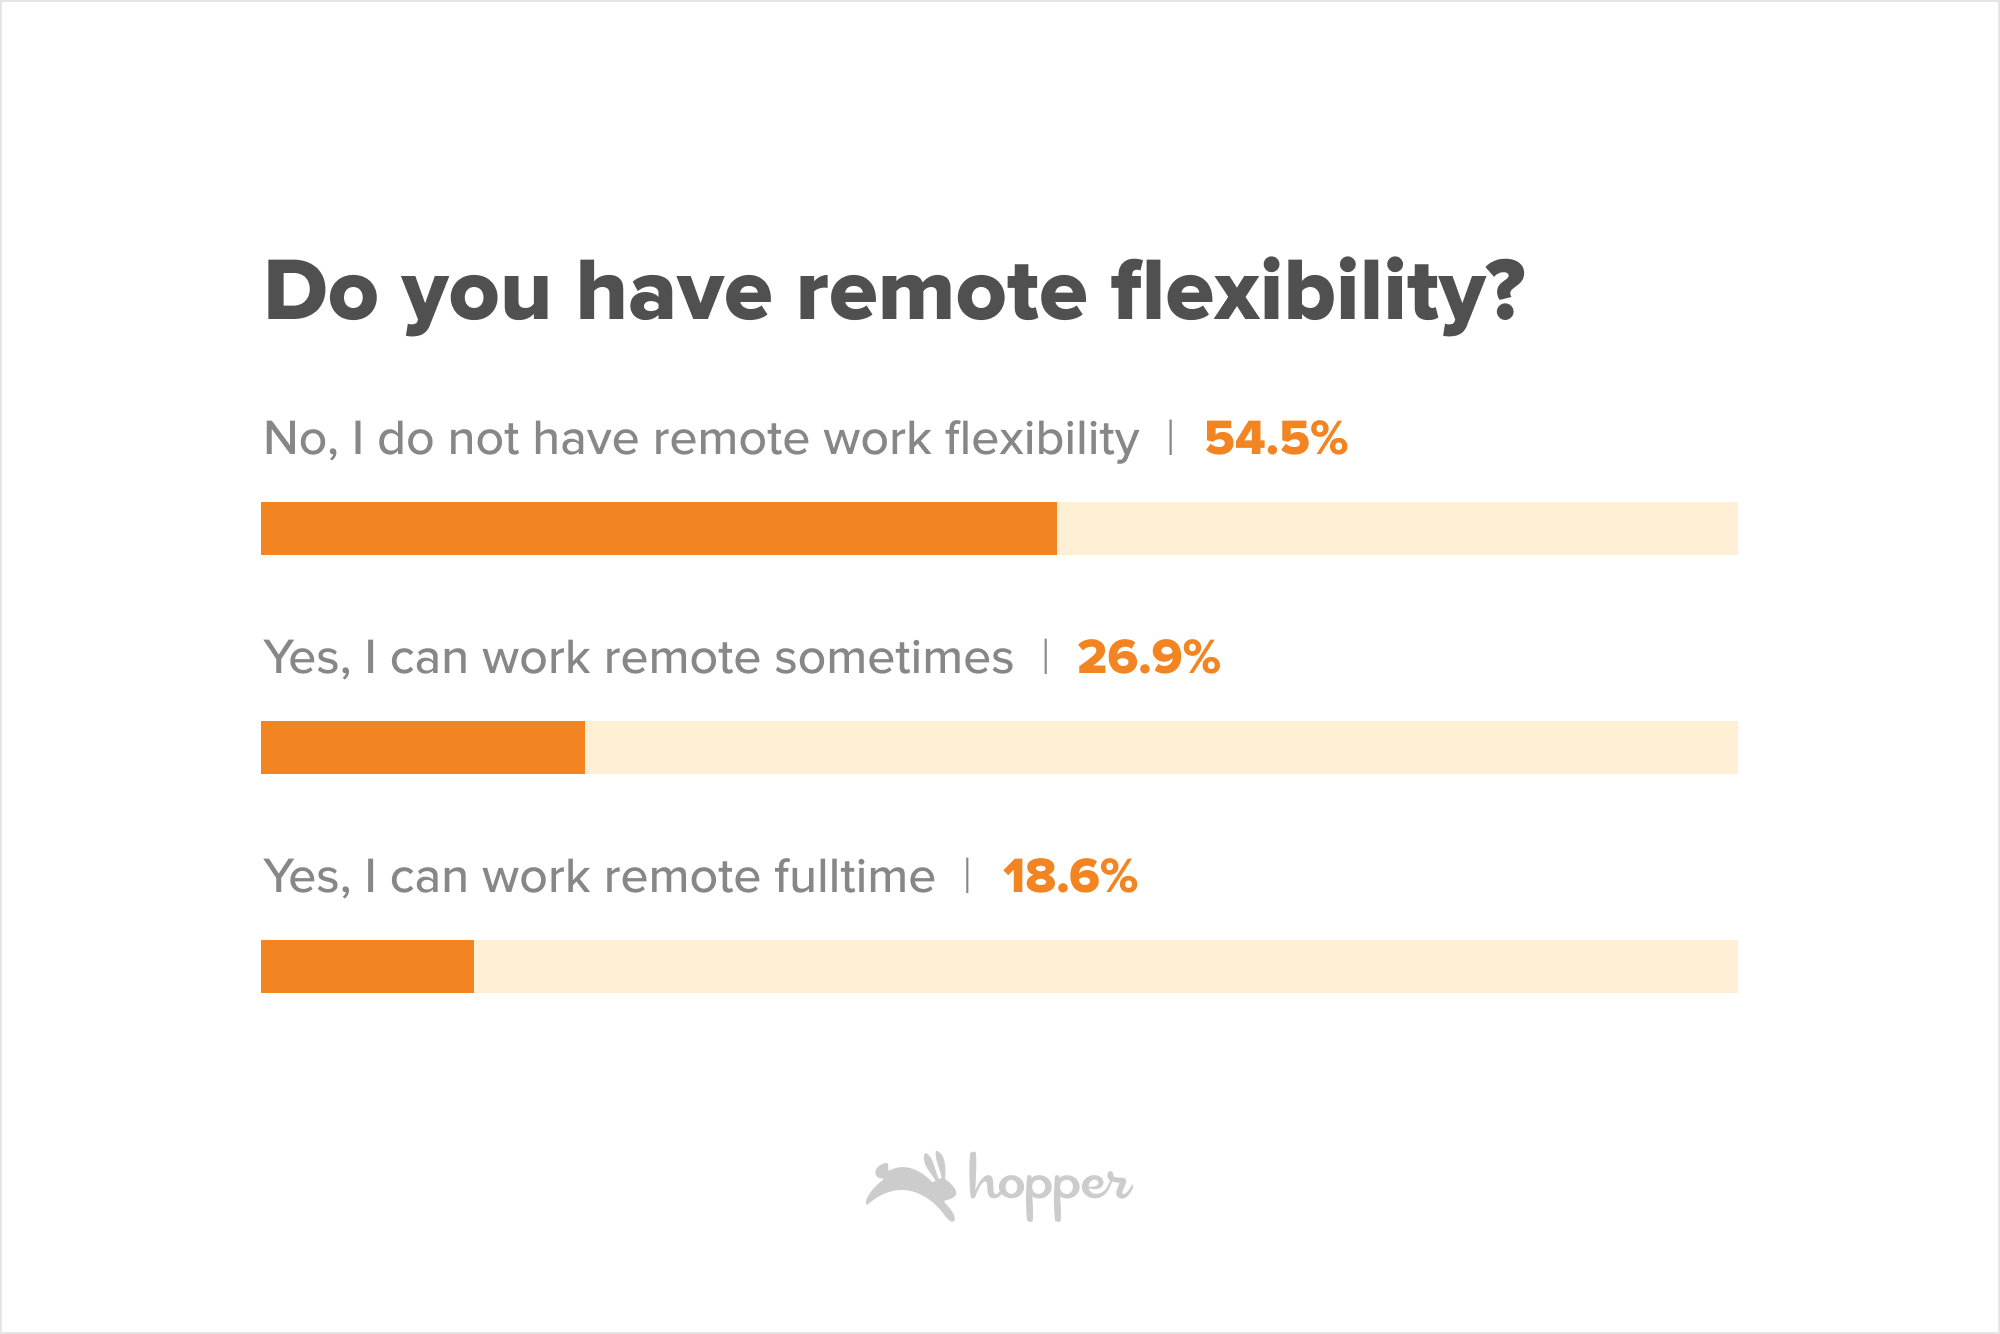
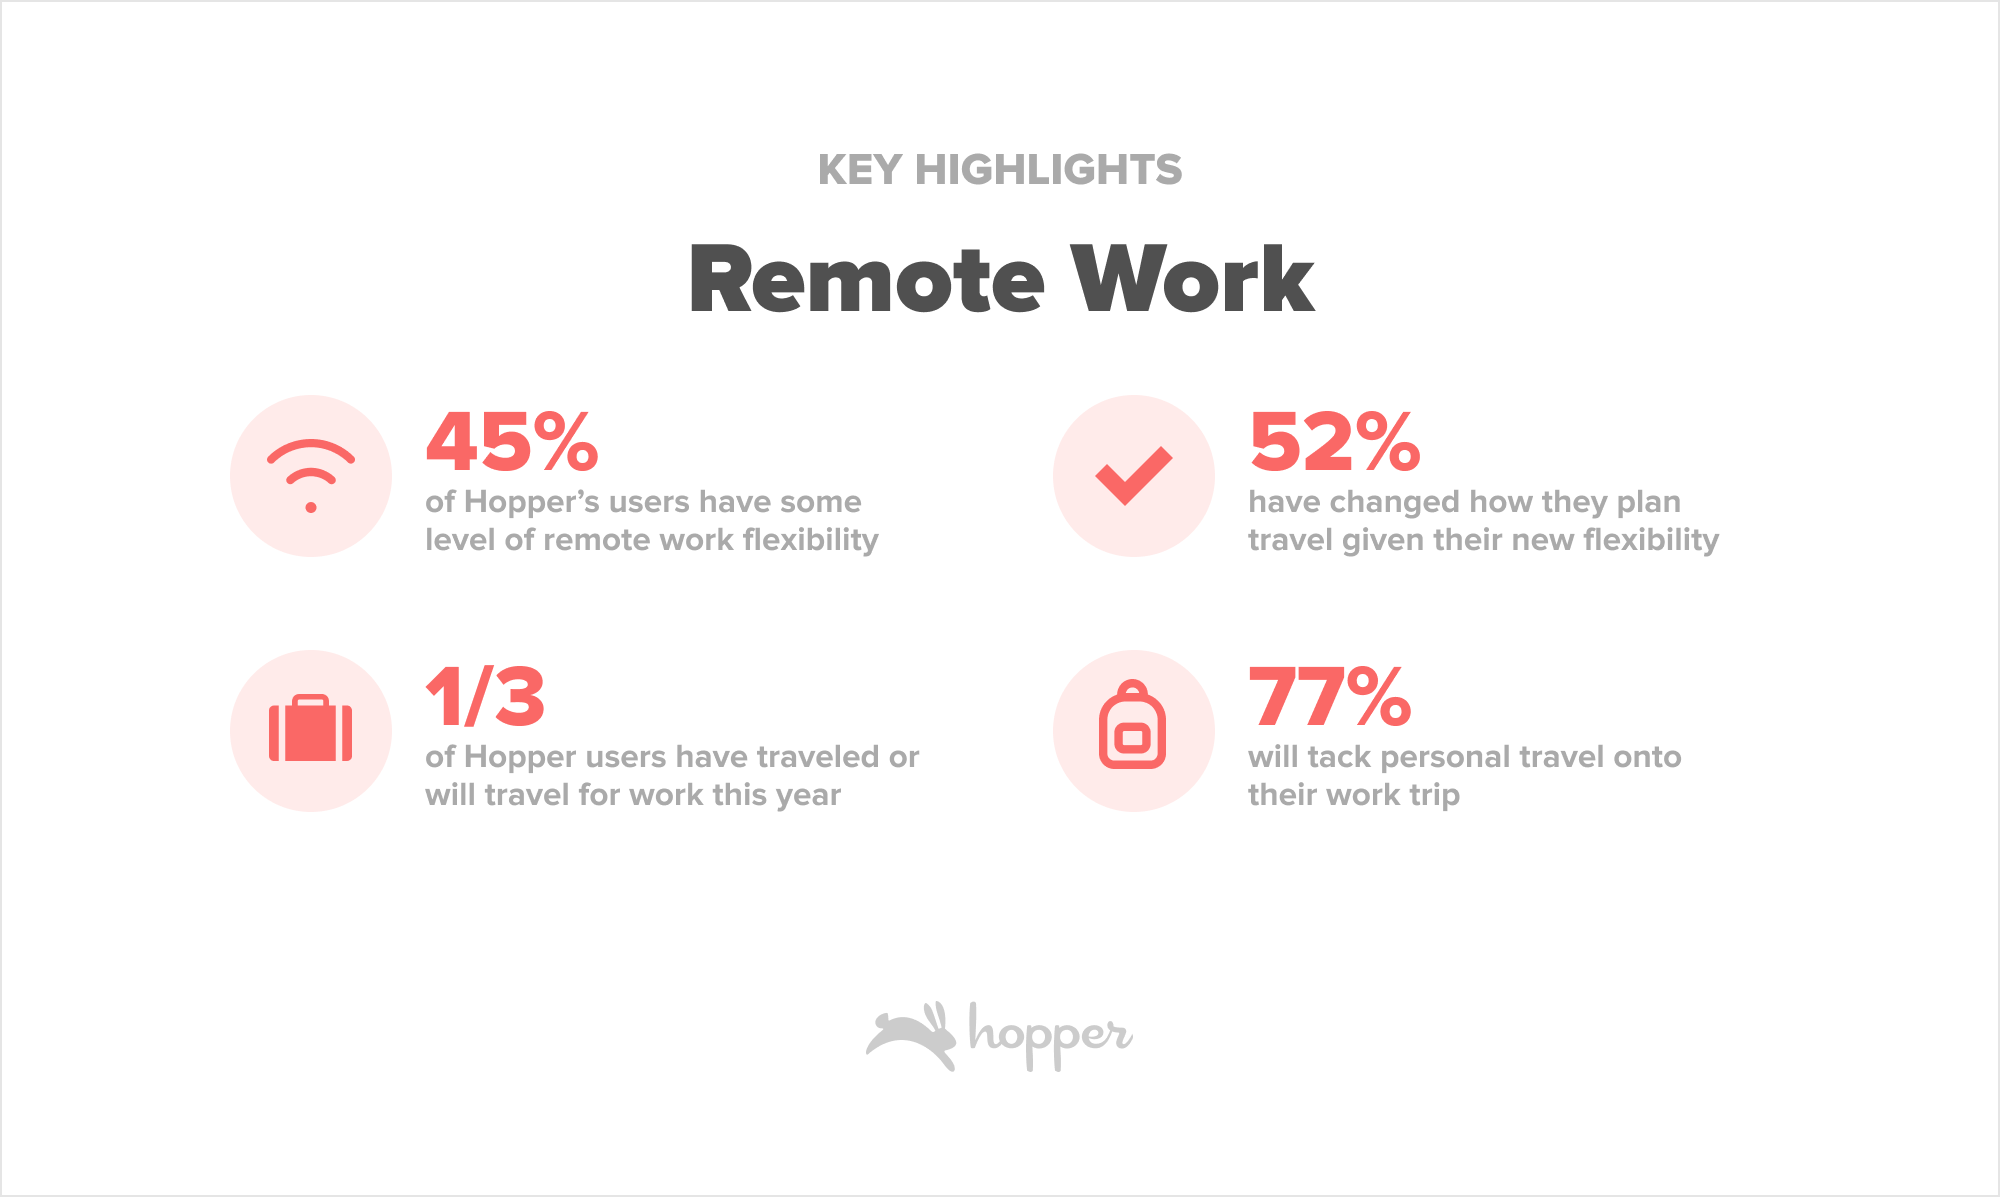
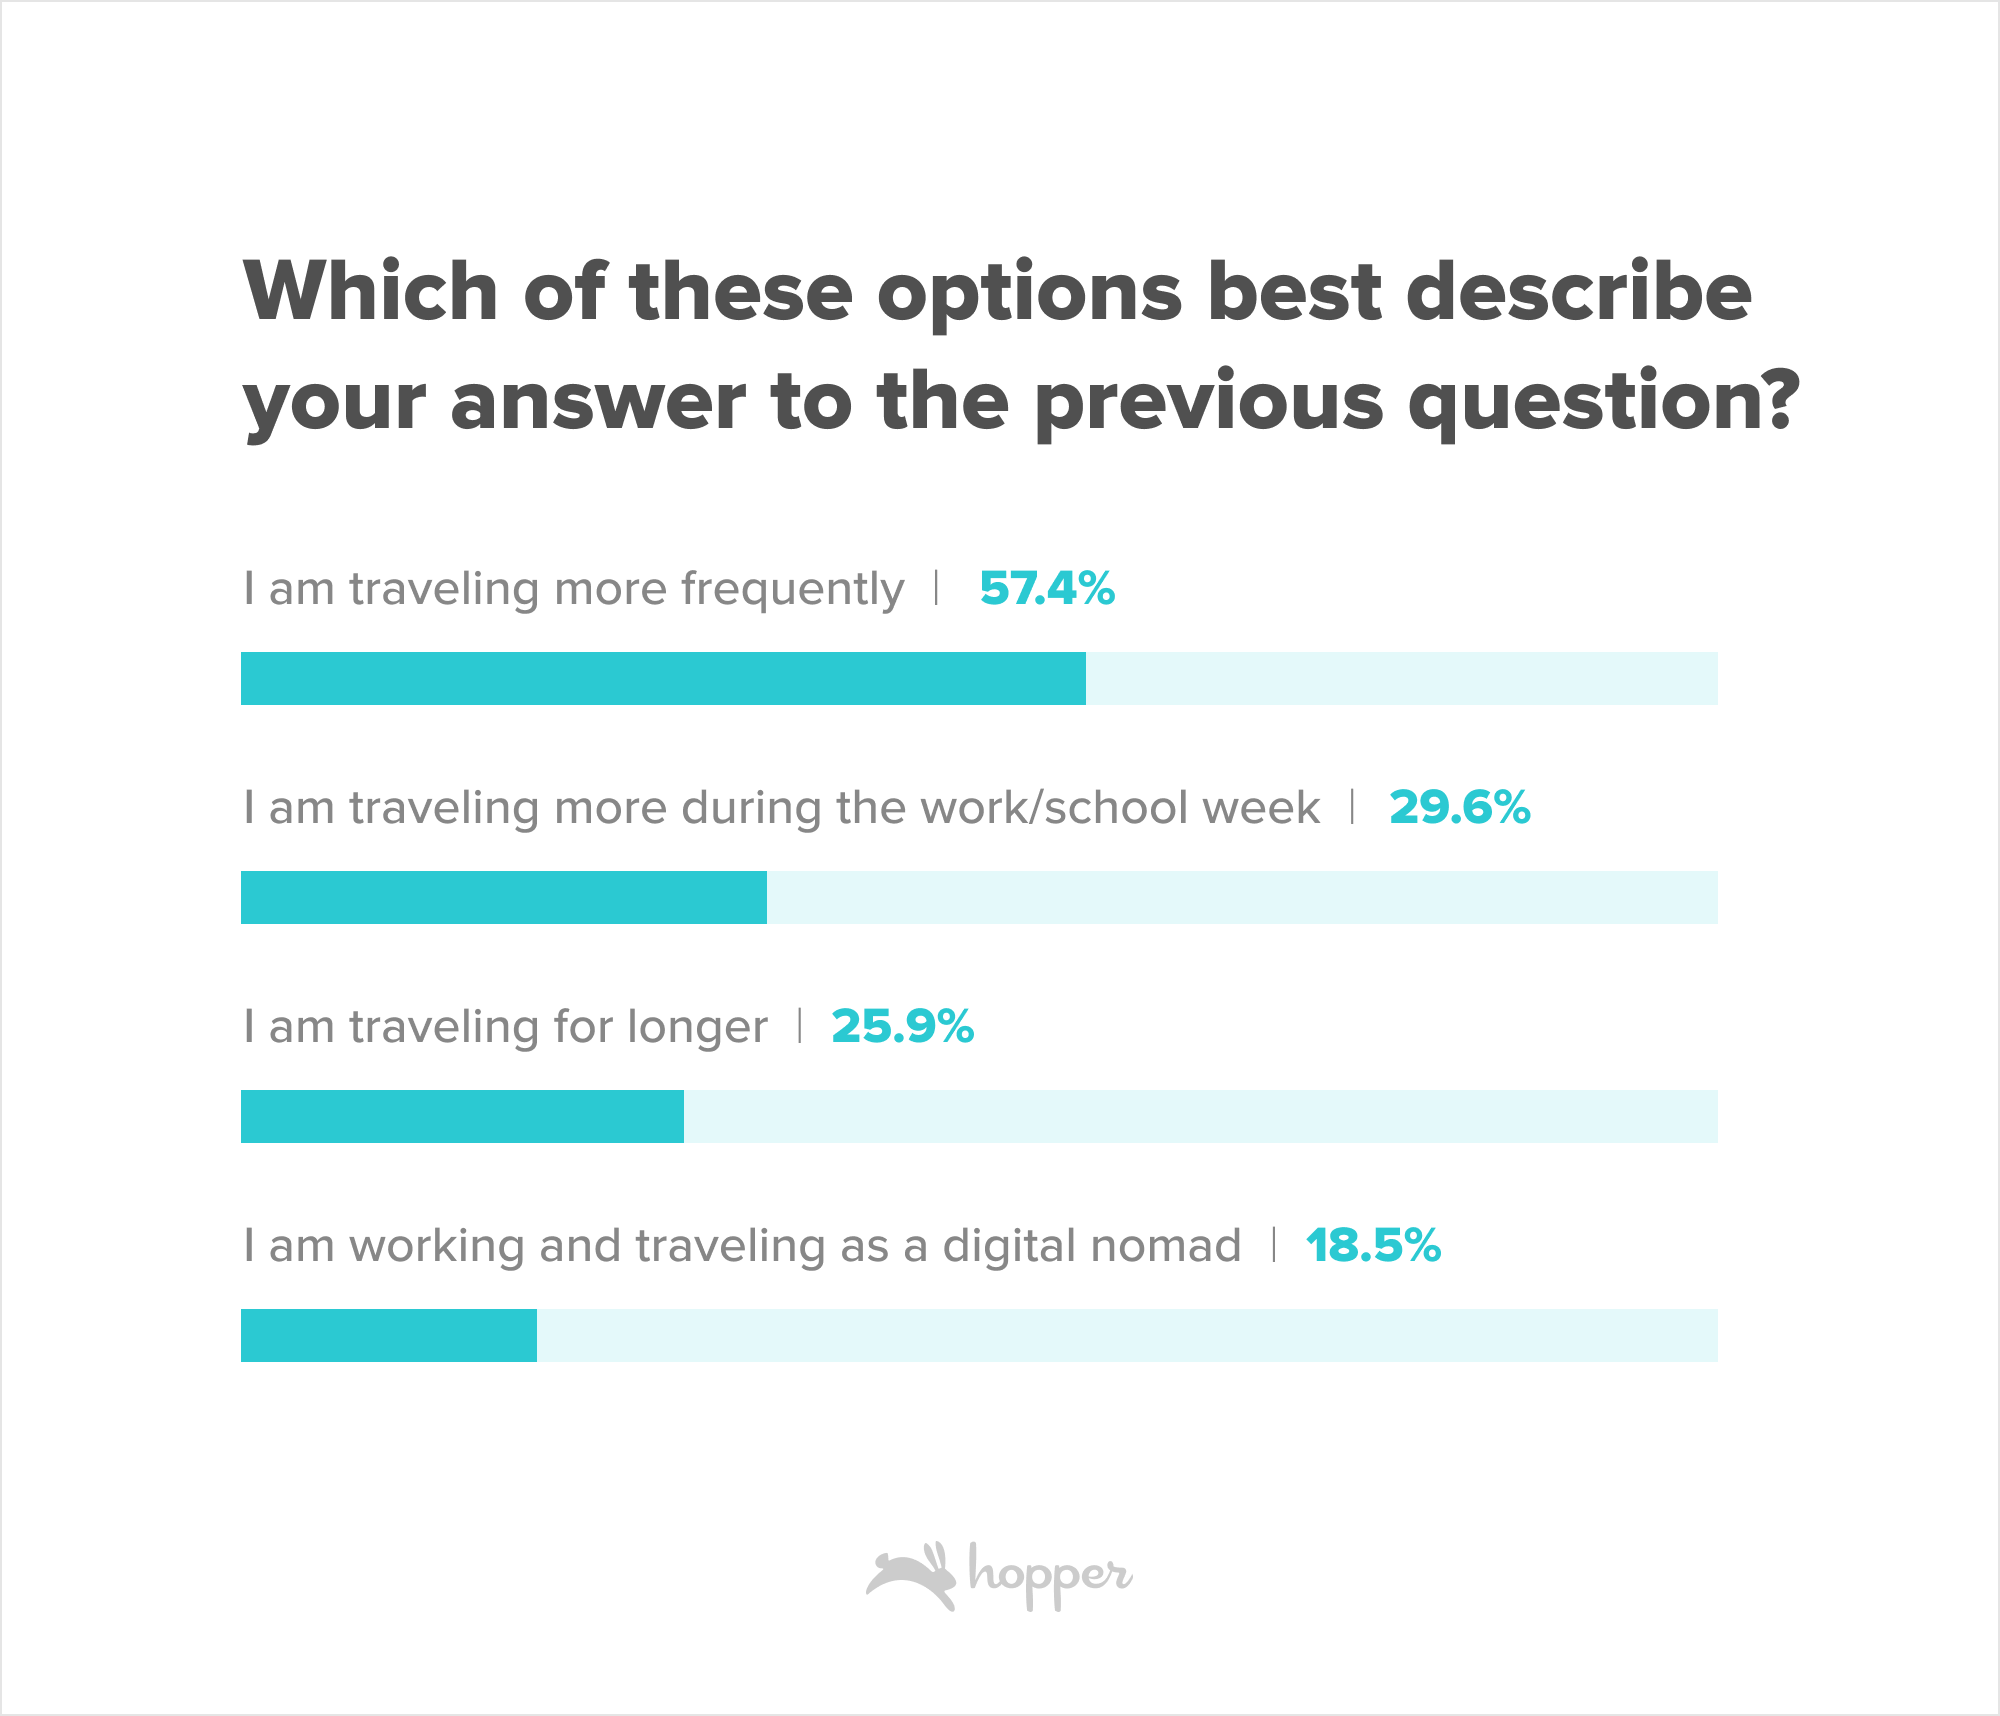
45% of Hopper’s users who are in the workforce or students have some level of remote work flexibility. Half (52%) of these users also say they have changed how they plan travel given their new flexibility. They are traveling more frequently, taking more trips mid-week and traveling for longer.
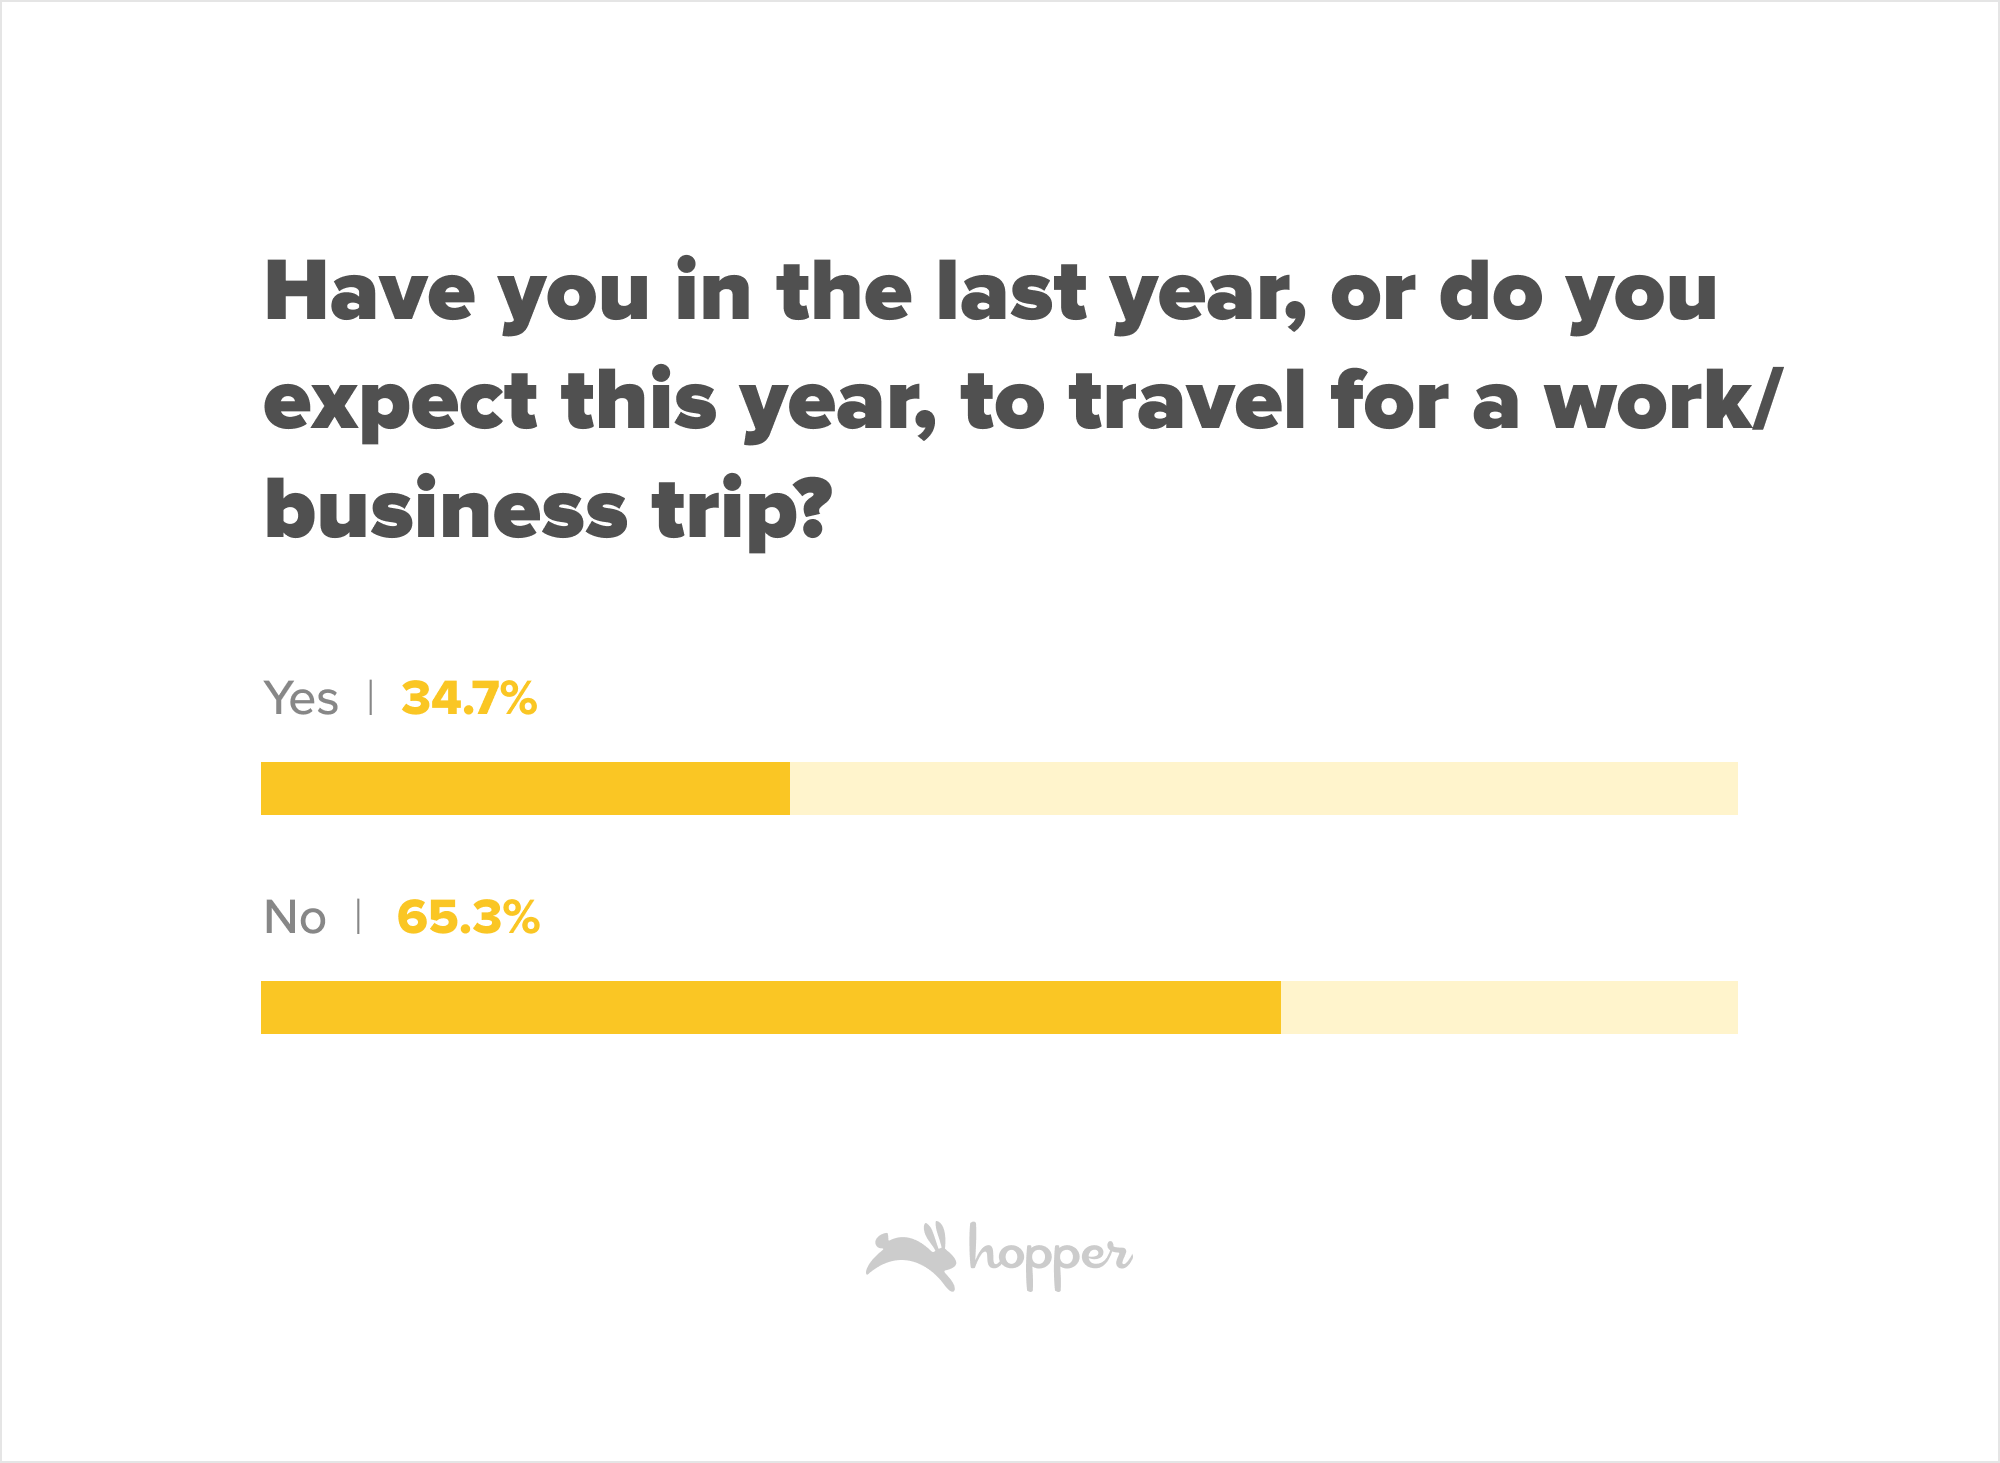
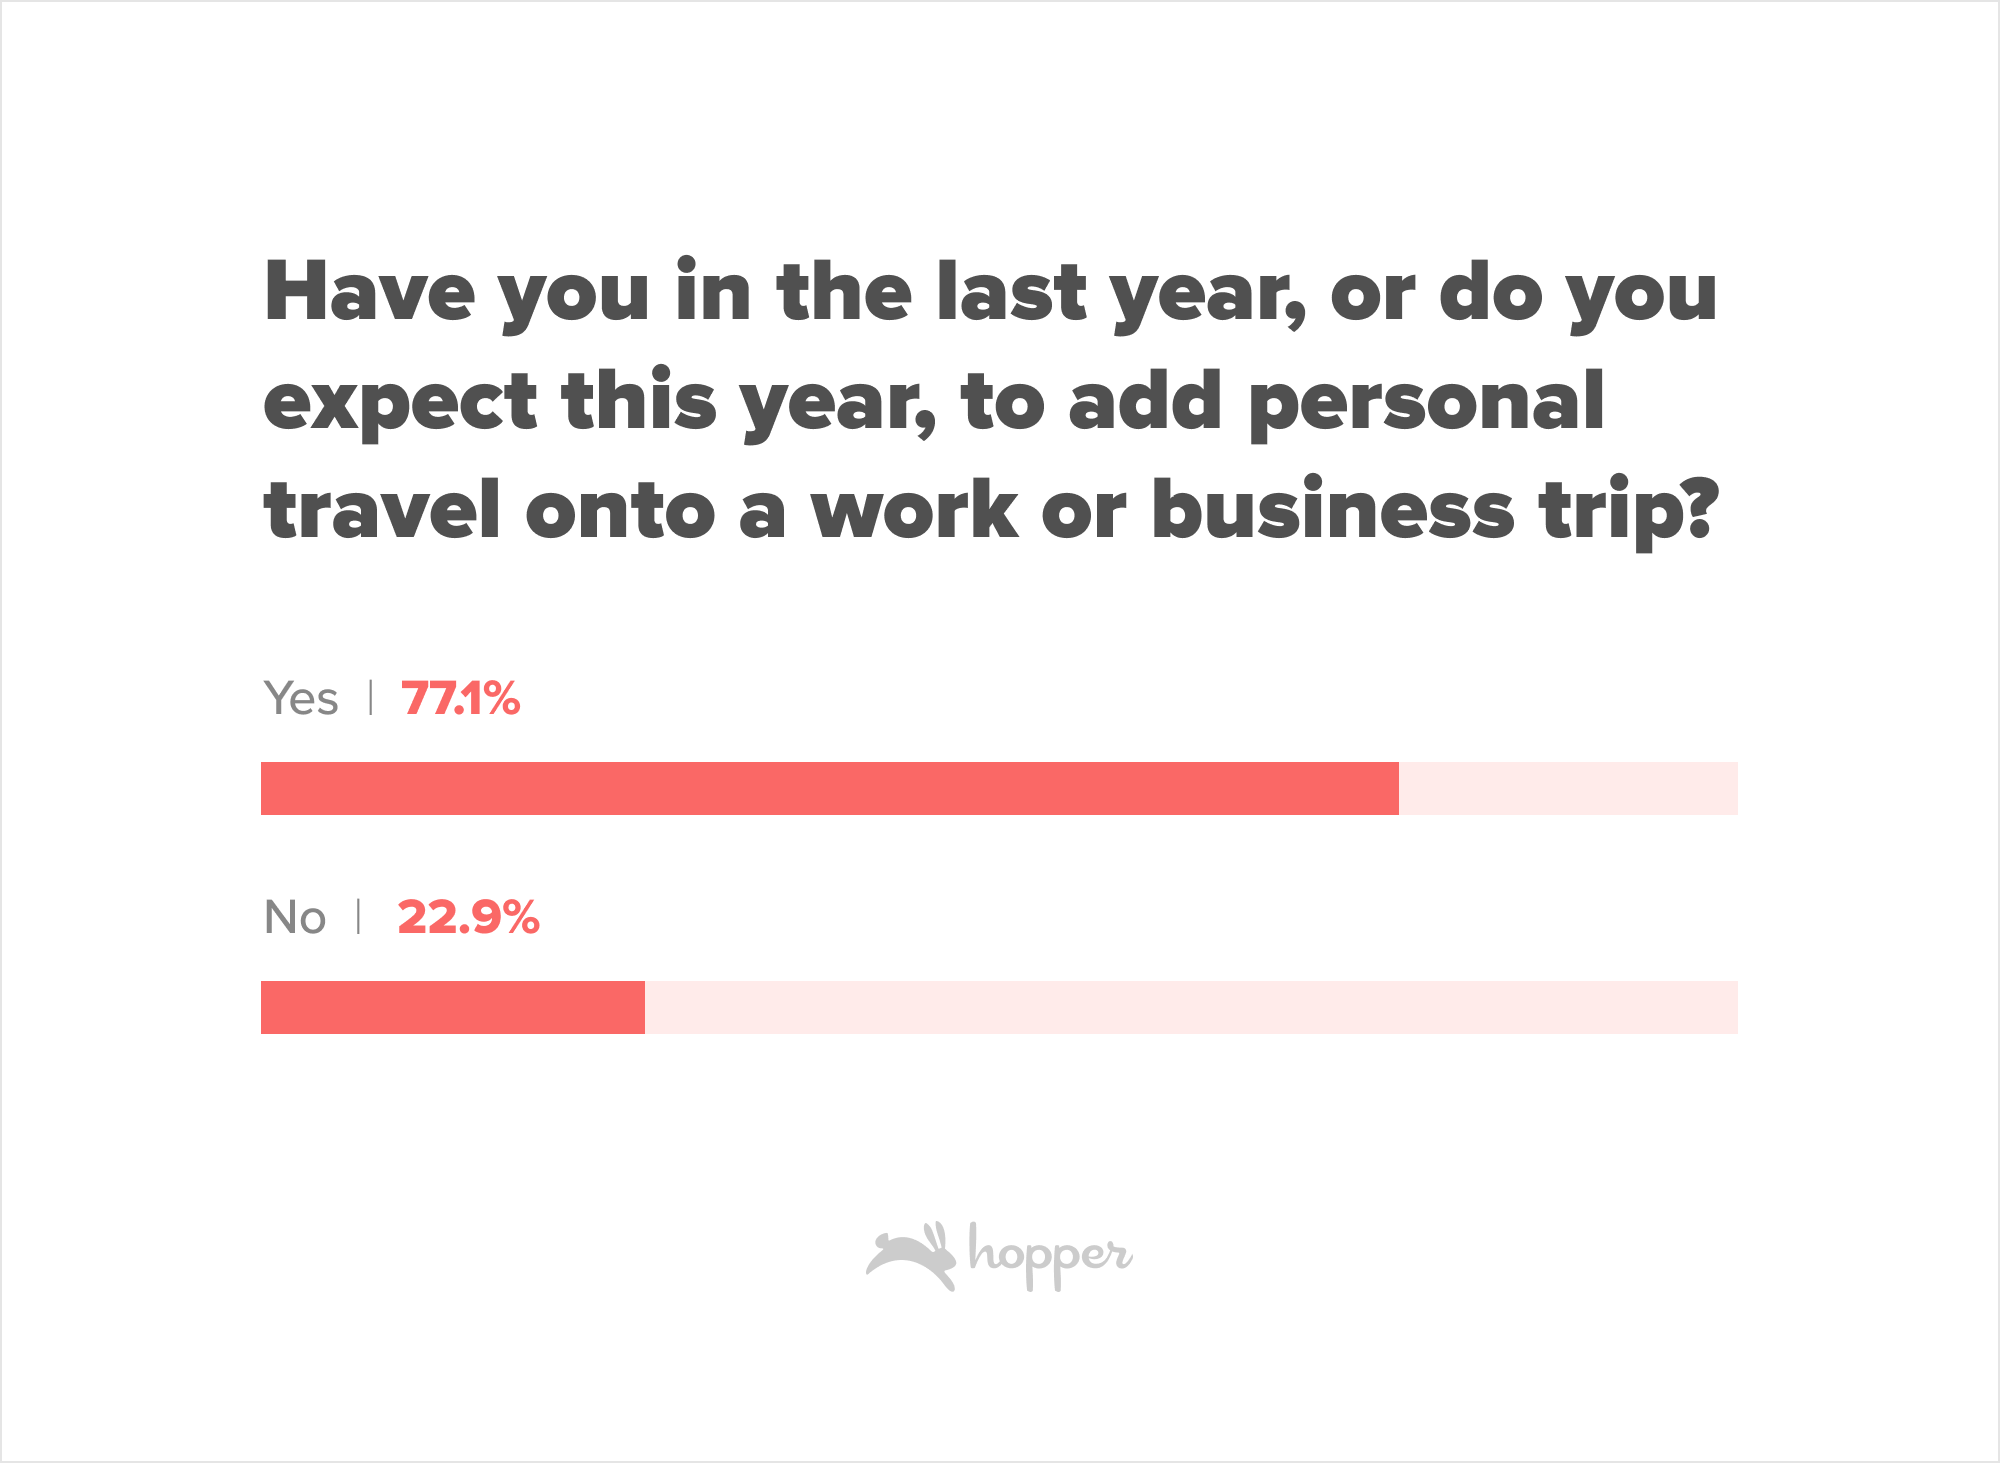
Even more interesting are those users who are adding personal travel onto corporate sponsored work trips. About ⅓ of Hopper users have traveled or expect to travel for work in the next year, and 77% of those users plan to tack personal travel onto the trip.
Booking Trends
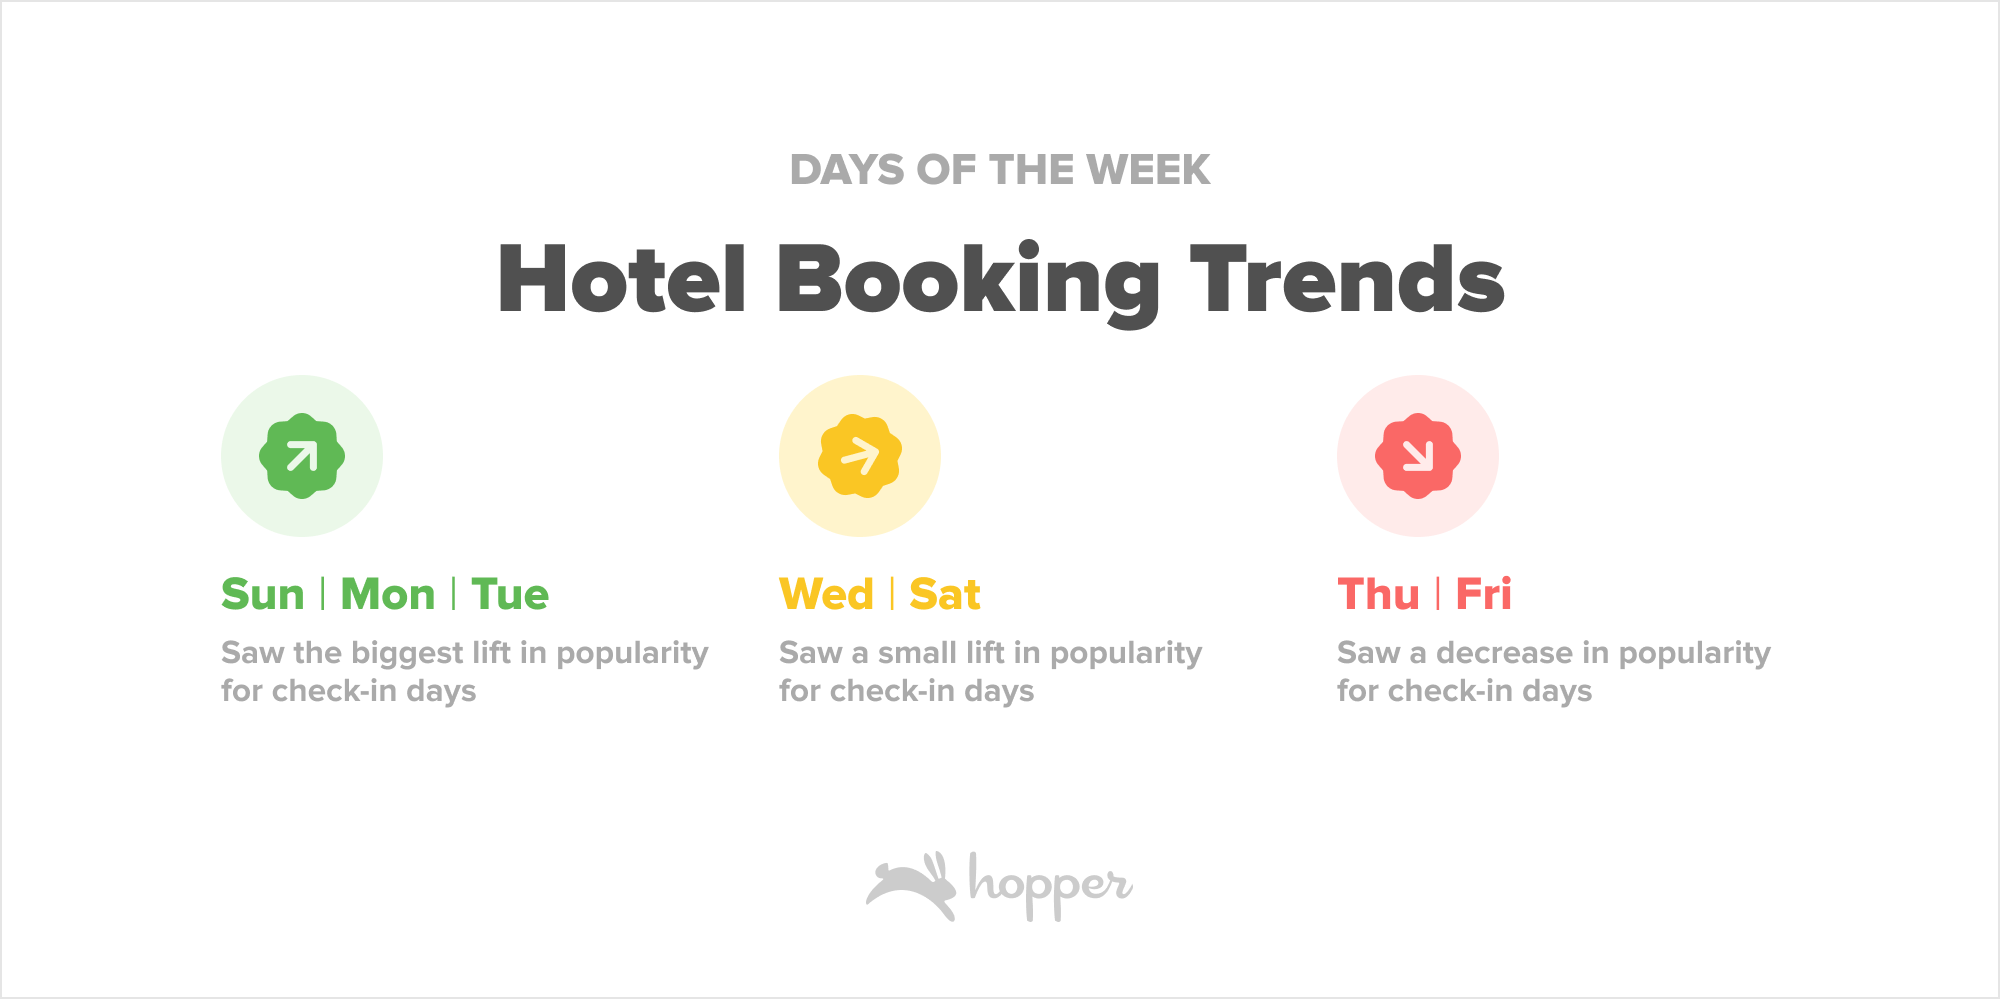
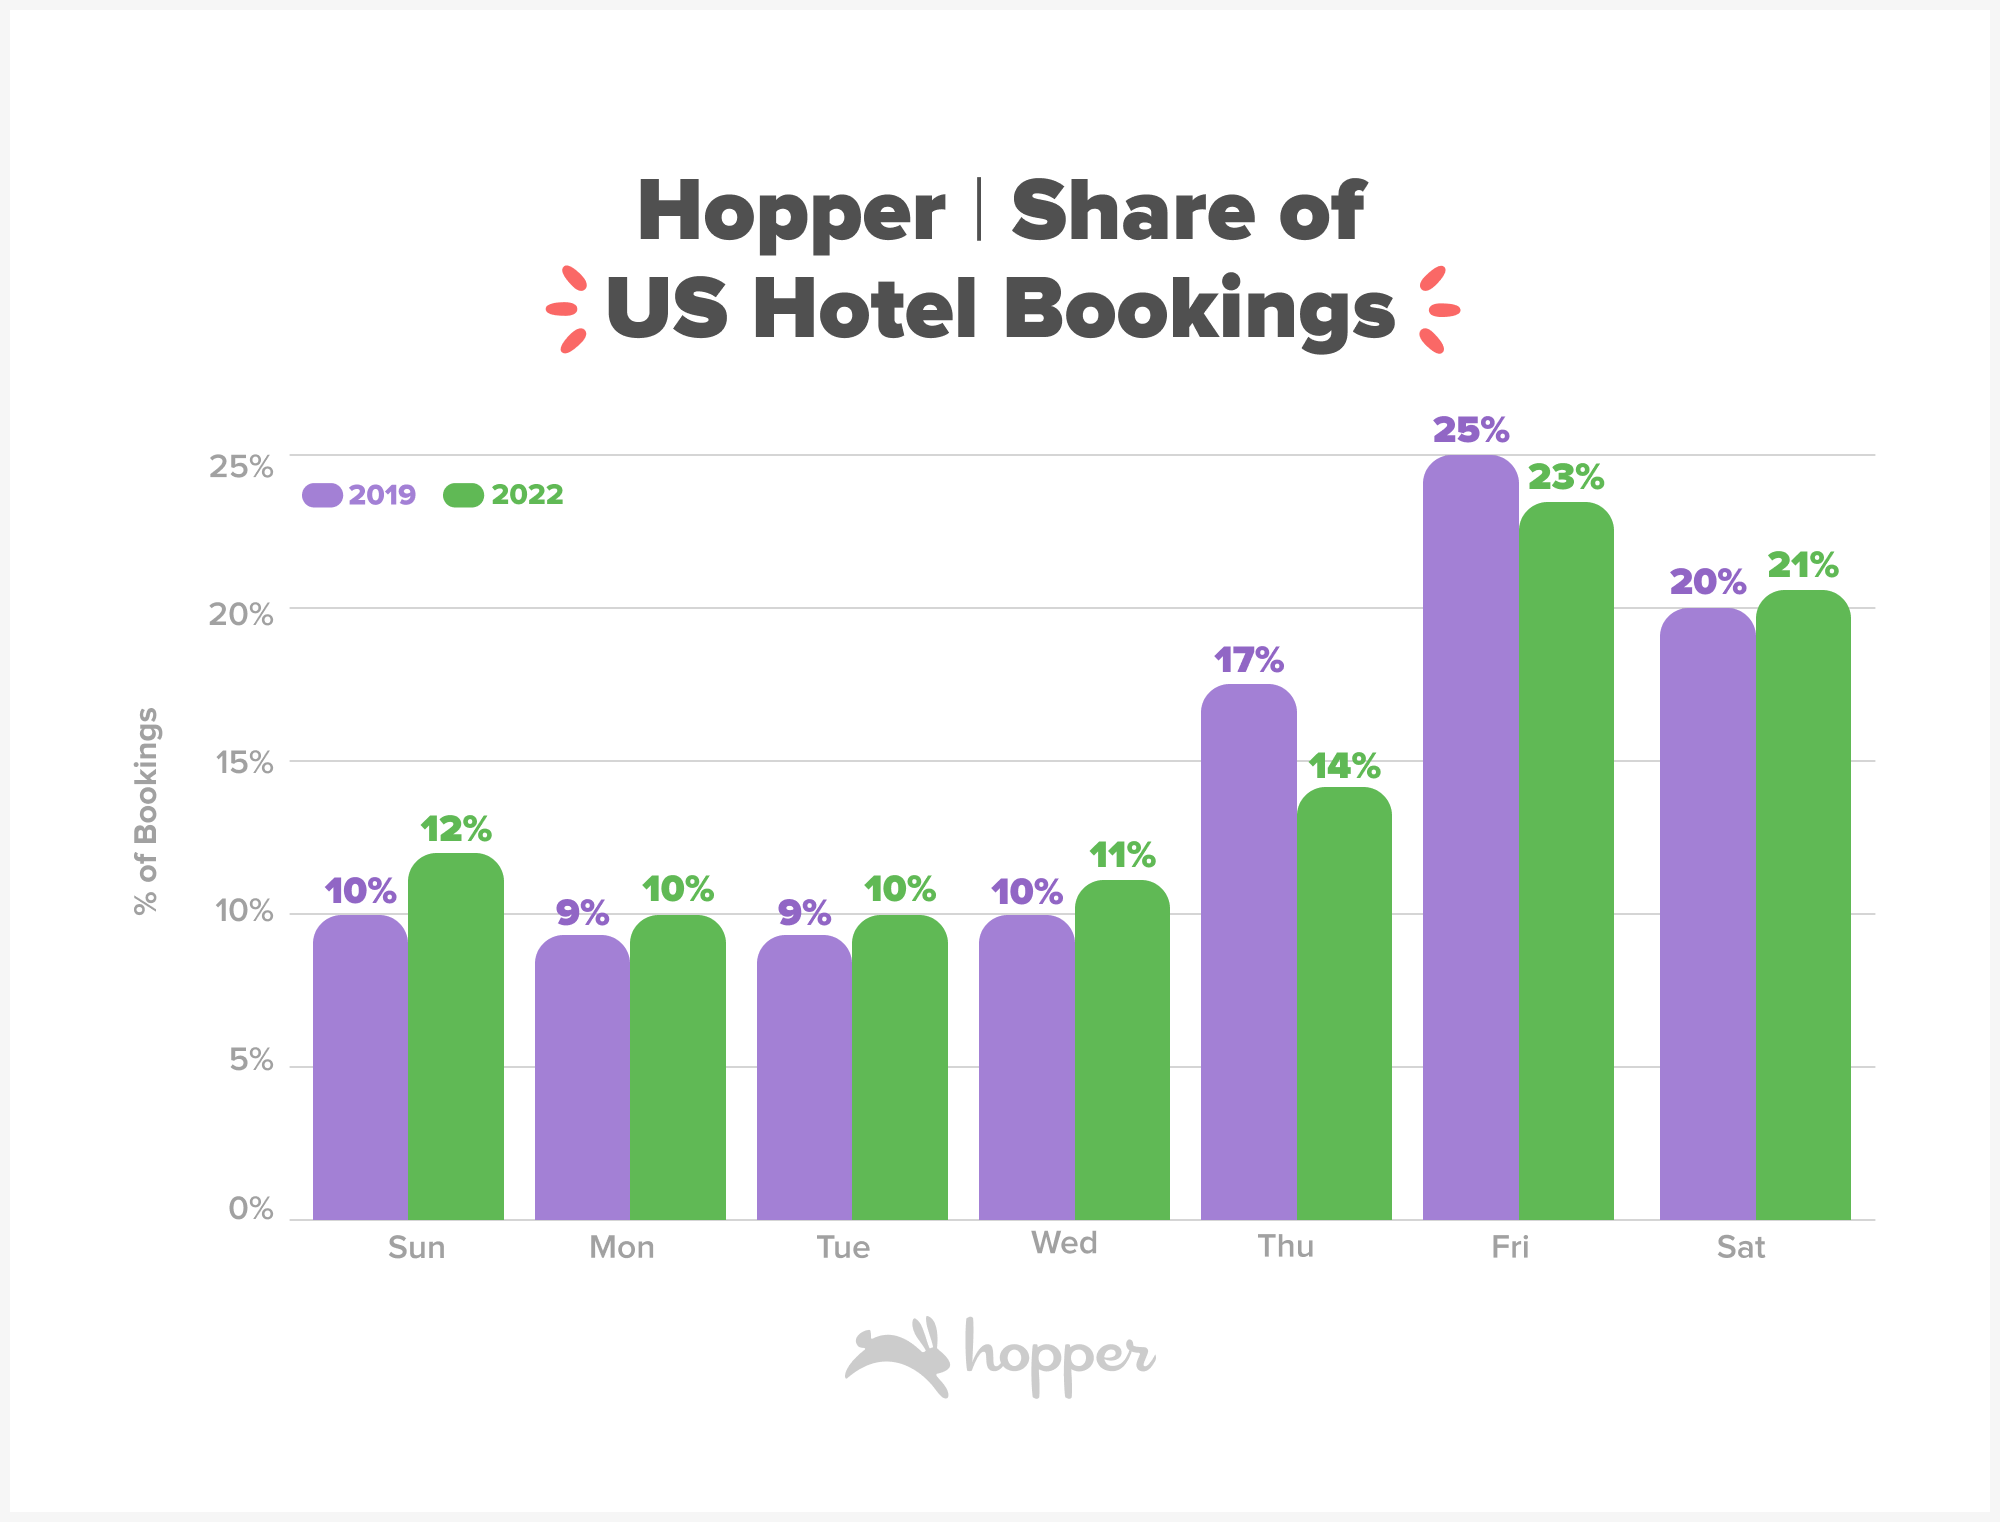
Travelers aren’t just talking the flexibility talk, they’re walking the walk. 2022 saw hotel bookings for Sunday, Monday and Tuesday check-ins grew significantly faster than Thursday and Friday, historically the most popular days of the week. Thursday and Friday lost a combined 6% points of share post-pandemic, about a 15% drop in share. Early week check-in dates picked up the most share with Sunday check-ins gaining 2.3% points of share (+23%) and Monday gaining 1.7% points (+25%). Saturday remained a popular check-in day of the week, growing slightly +6% points) since pre-pandemic
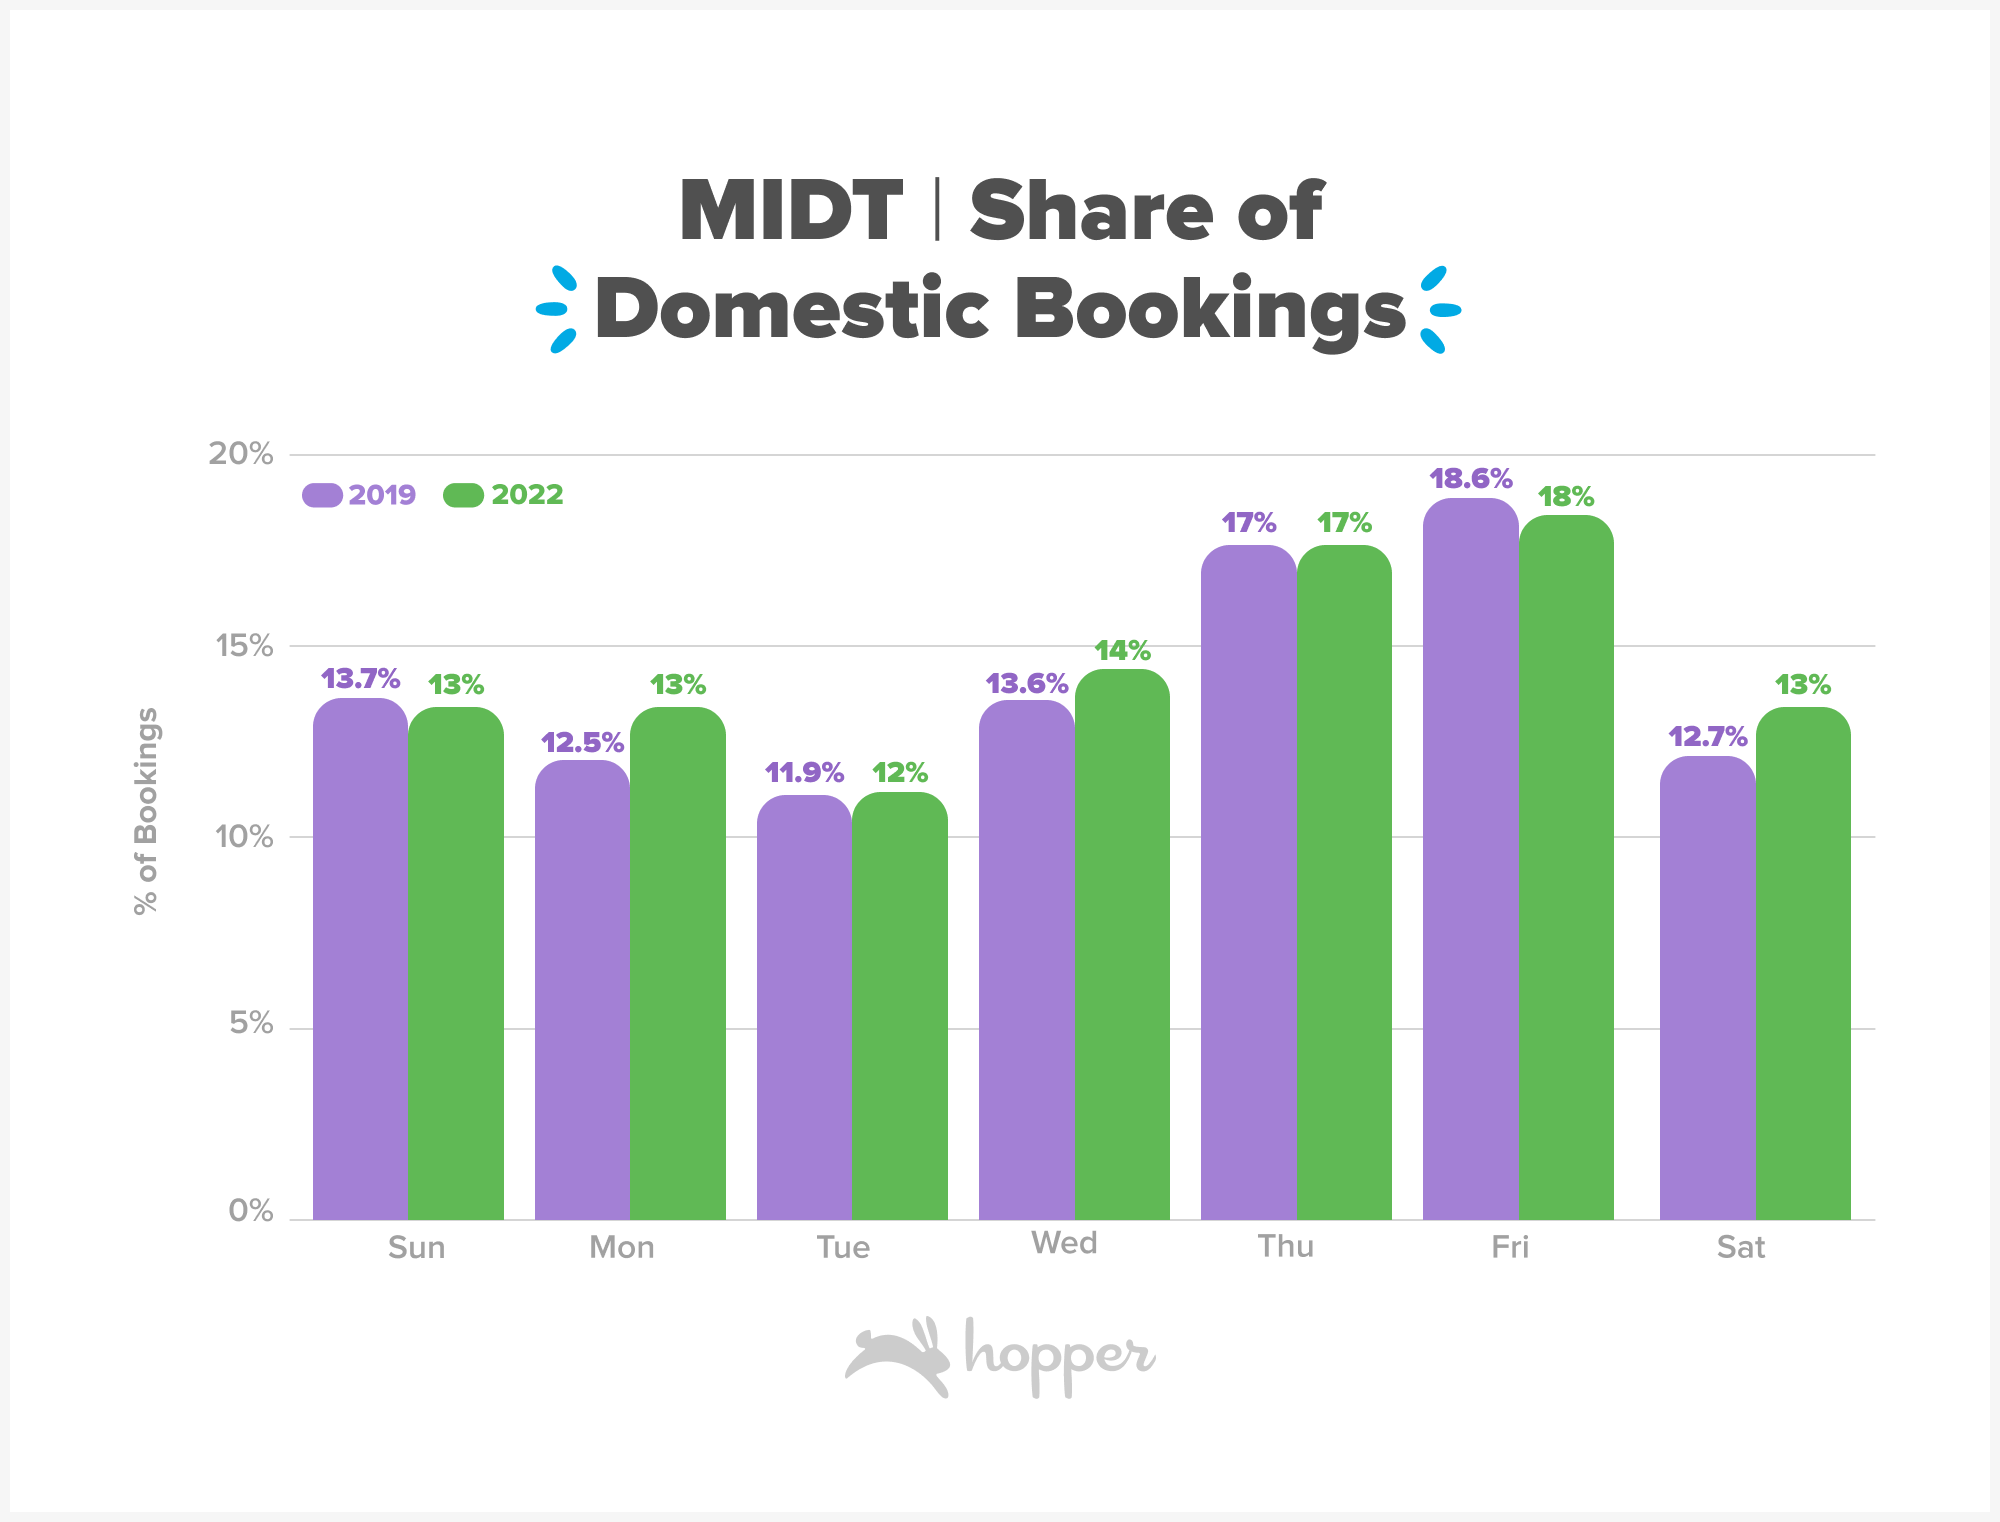
Travelers carried this early in the week preference through to flight bookings as well, with Americans increasingly booking flights departing on Monday and Tuesday compared to pre-pandemic. Bookings for early in the week departures grew faster than all other days of the week (+4%), at the expense of Friday departures. This trend was even stronger among Hopper bookers, where Sunday (+10%) and Monday (+7%) increased booking share even more than among general US bookers. International travel saw Sunday, Monday and Tuesday departure dates increase in popularity relative to pre-pandemic, eroding the popularity of Thursday, Friday and Saturday.
Destinations
Where are travelers going in 2023?
Demand for international travel has improved from its lowest point in 2021, when just 43% of searches made across the United States were for international trips. Today, 53% of searches from the U.S are for international trips compared to 56% pre-pandemic, showing the major recovery of international travel demand in 2022.
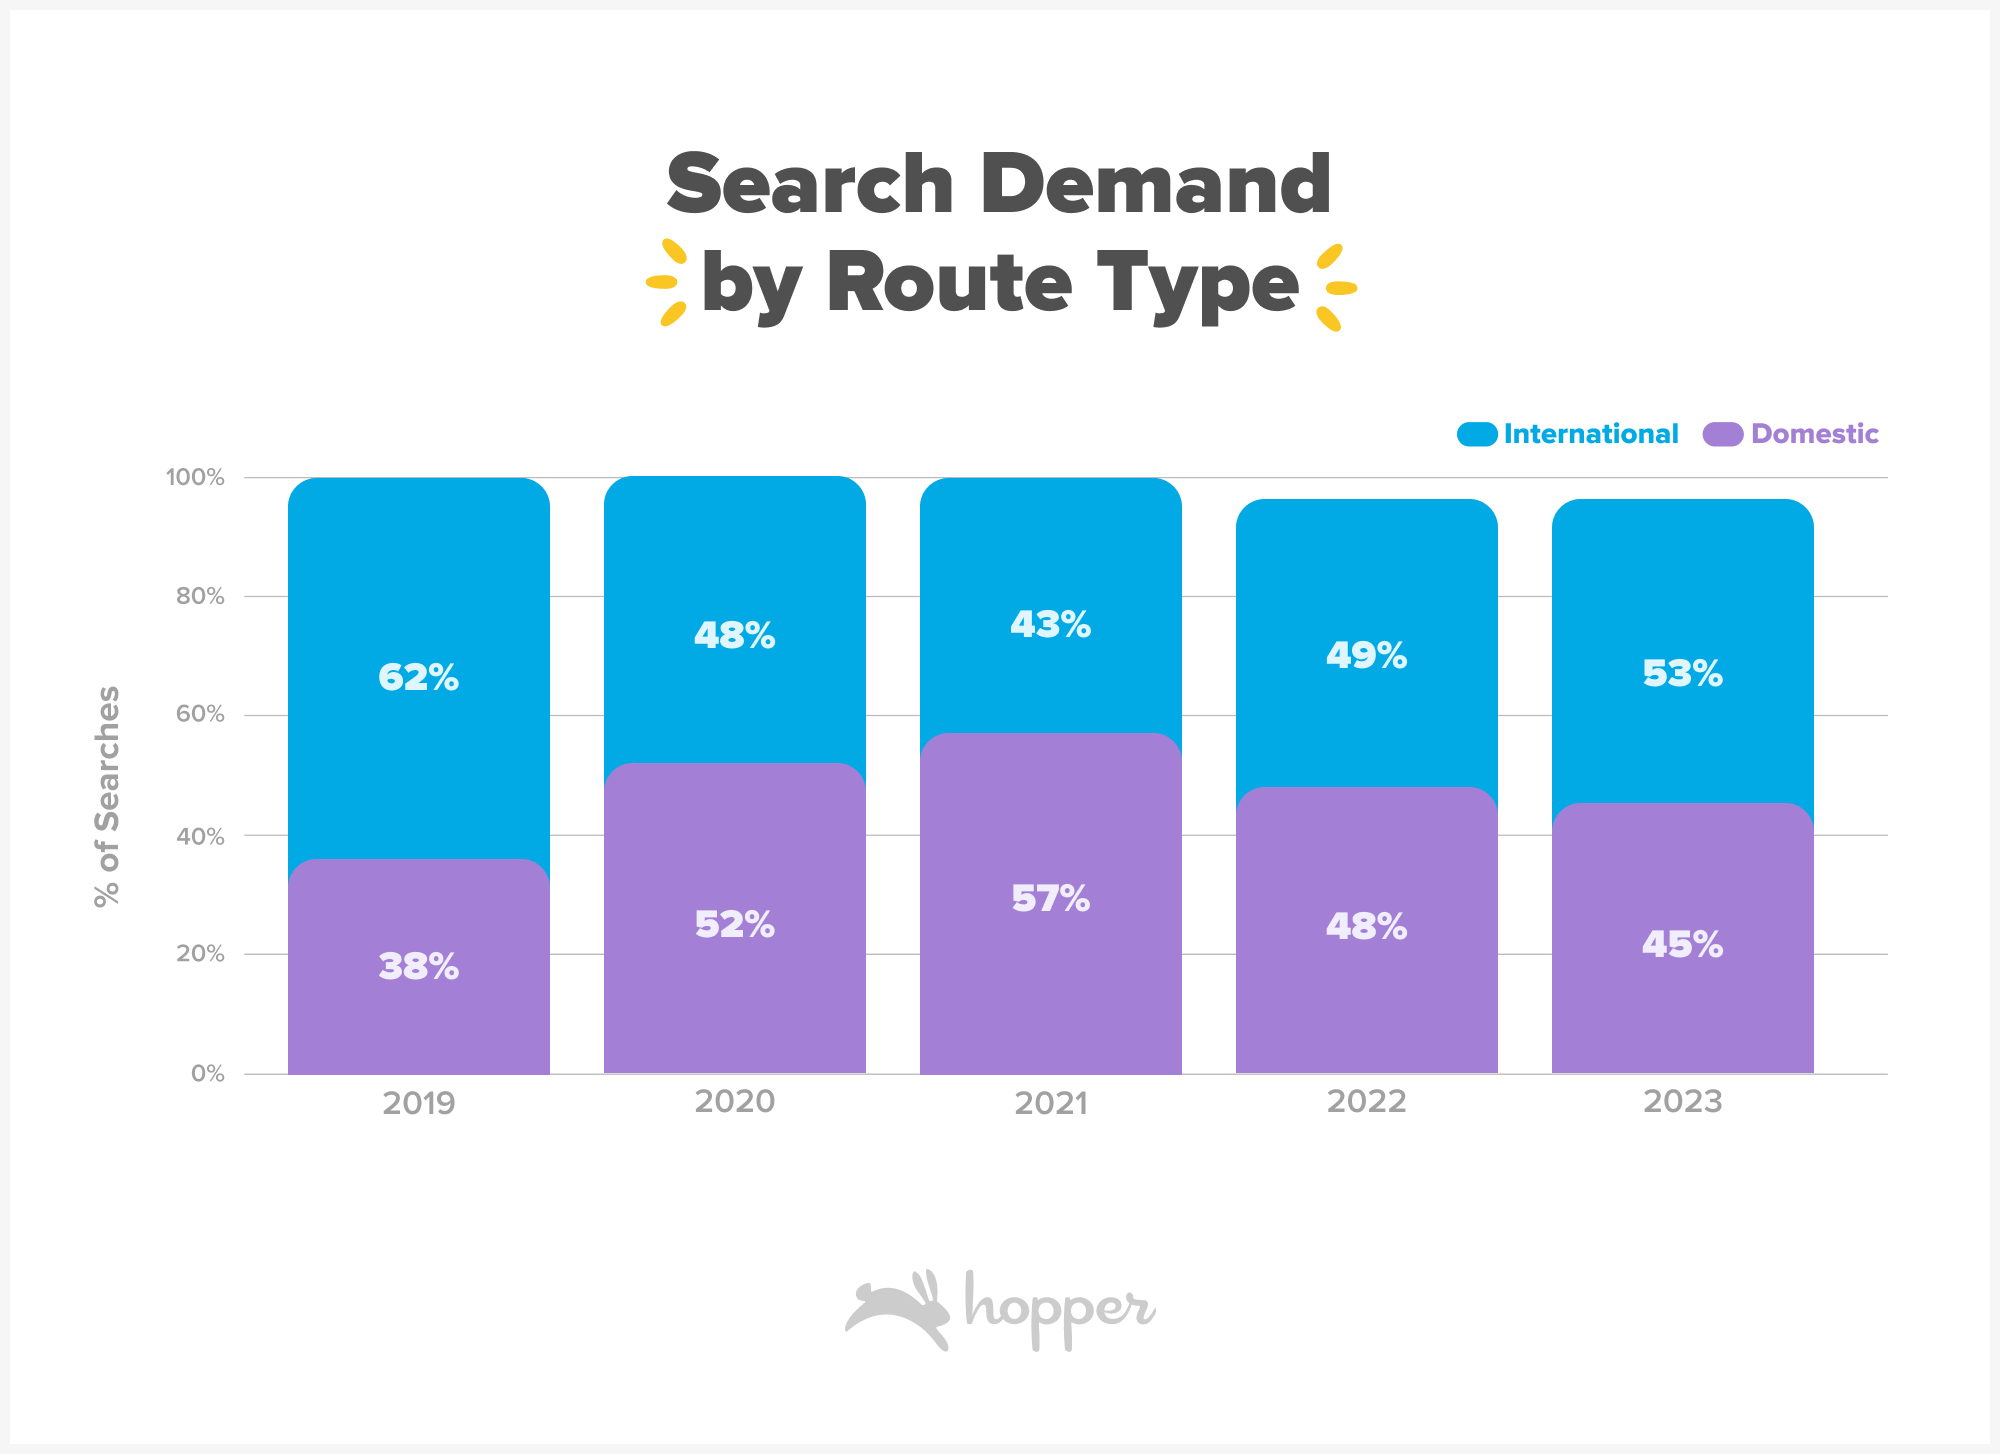
Figure: Percent of searches made from the US to domestic or international destinations based on GDS searches in each full year and 2023 elapsed.
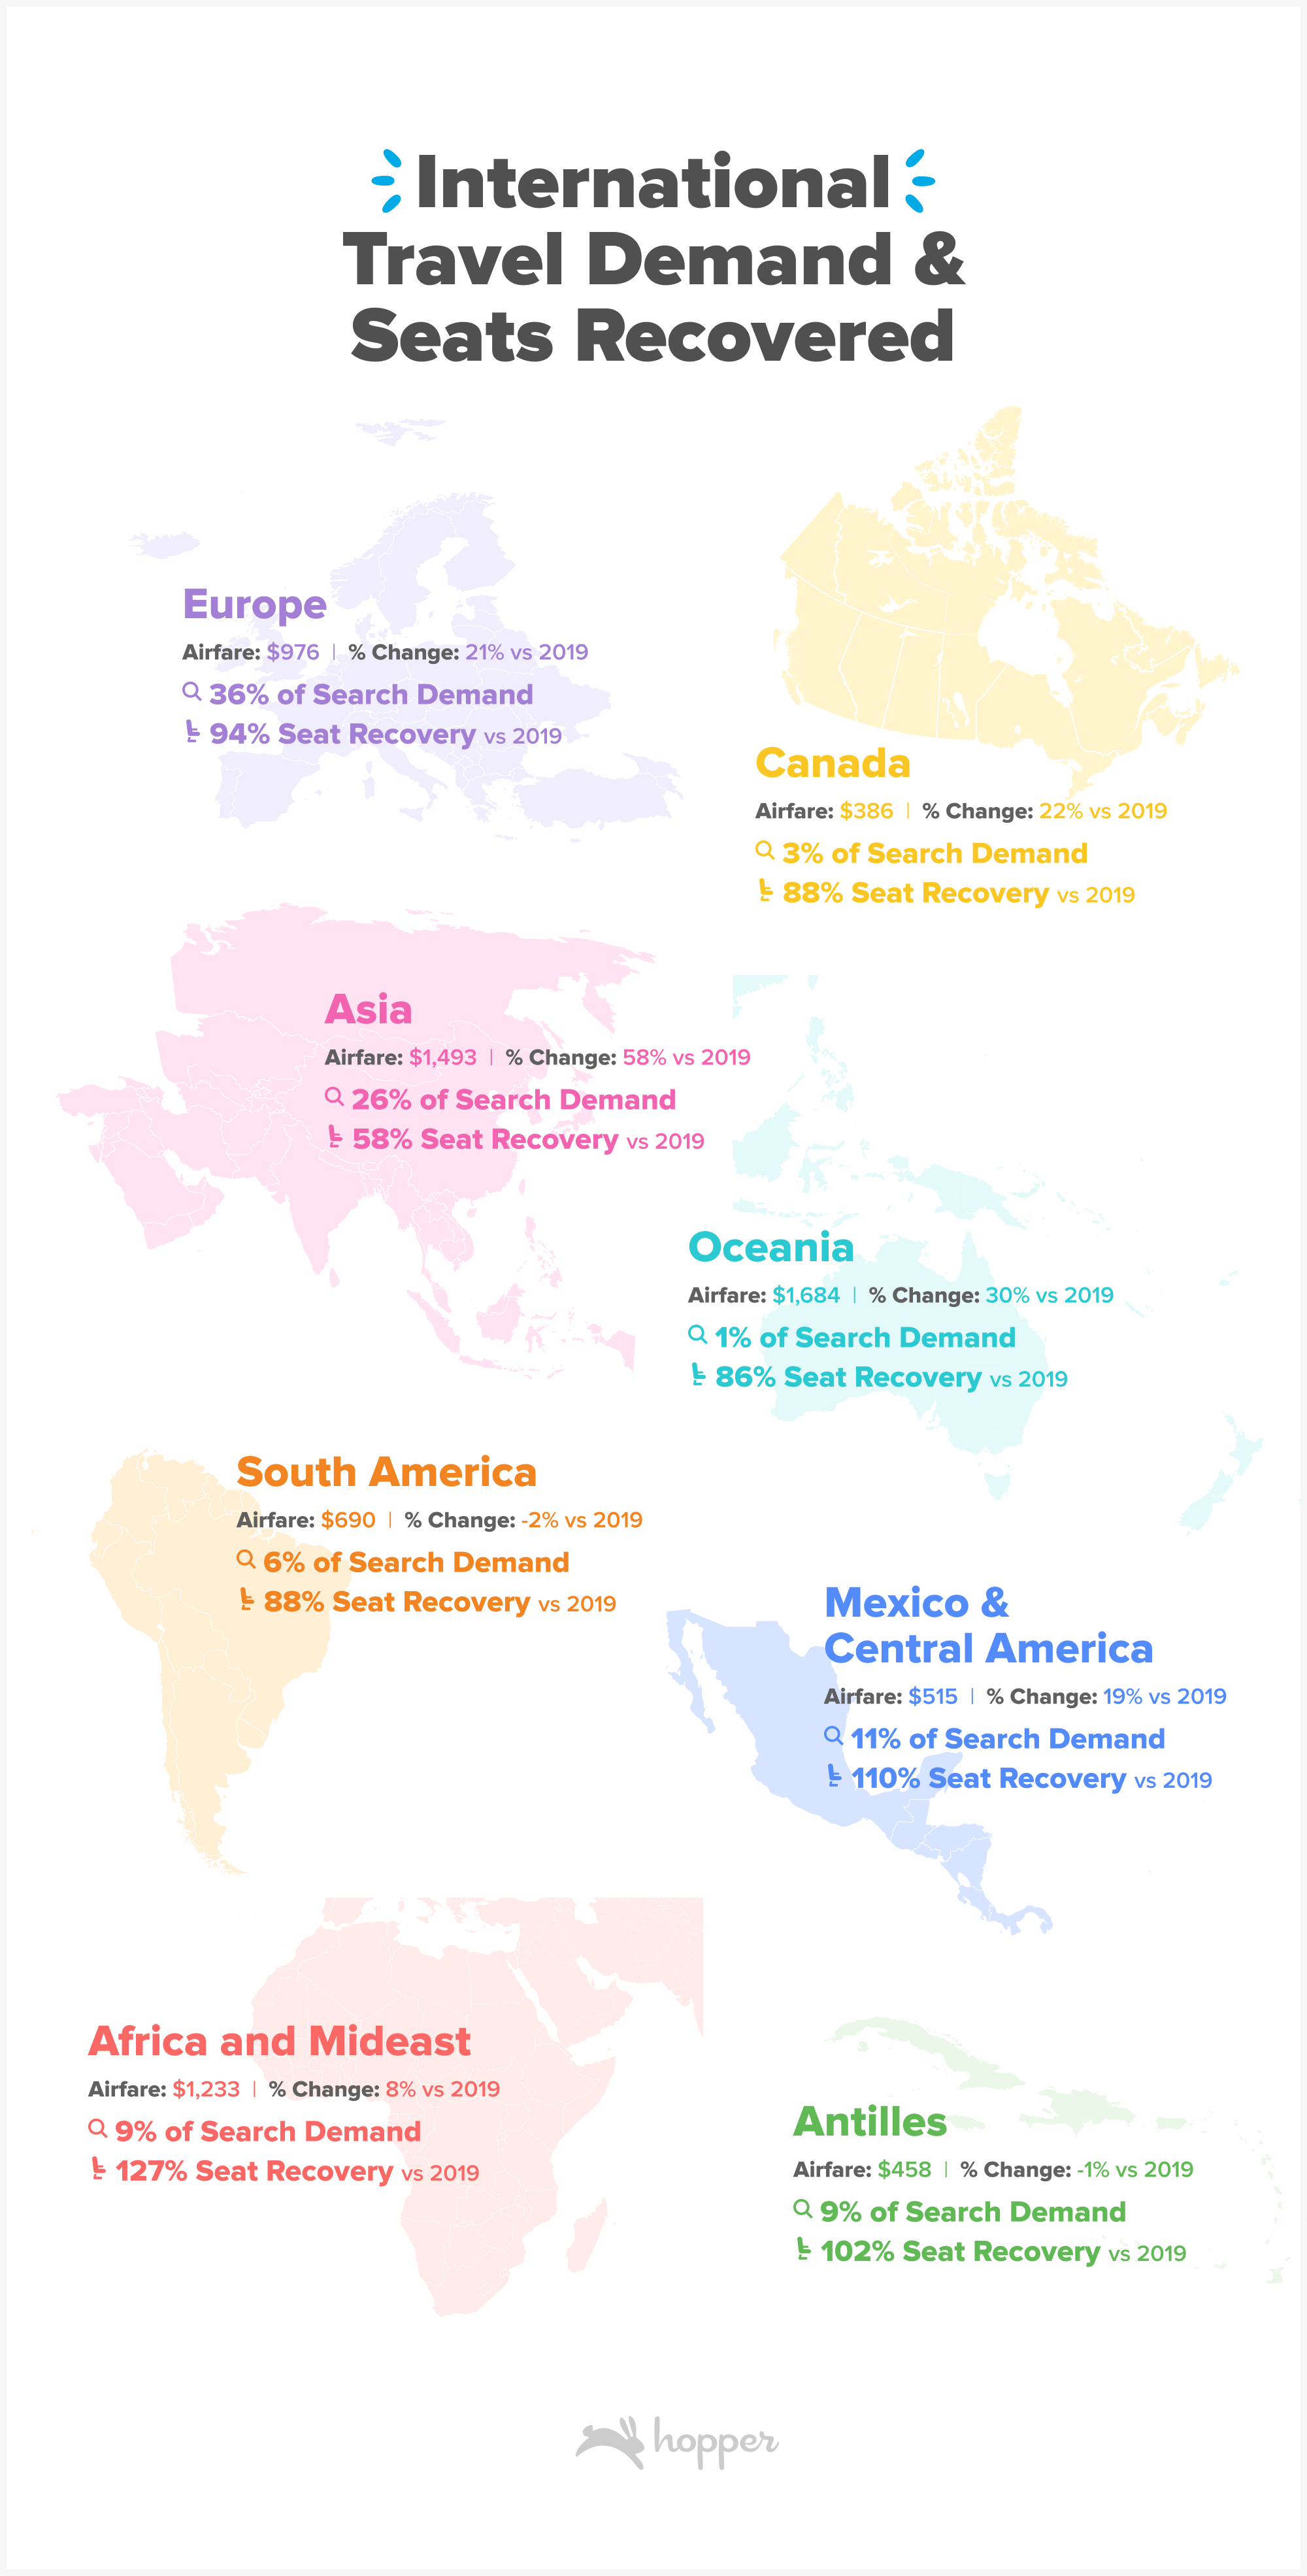
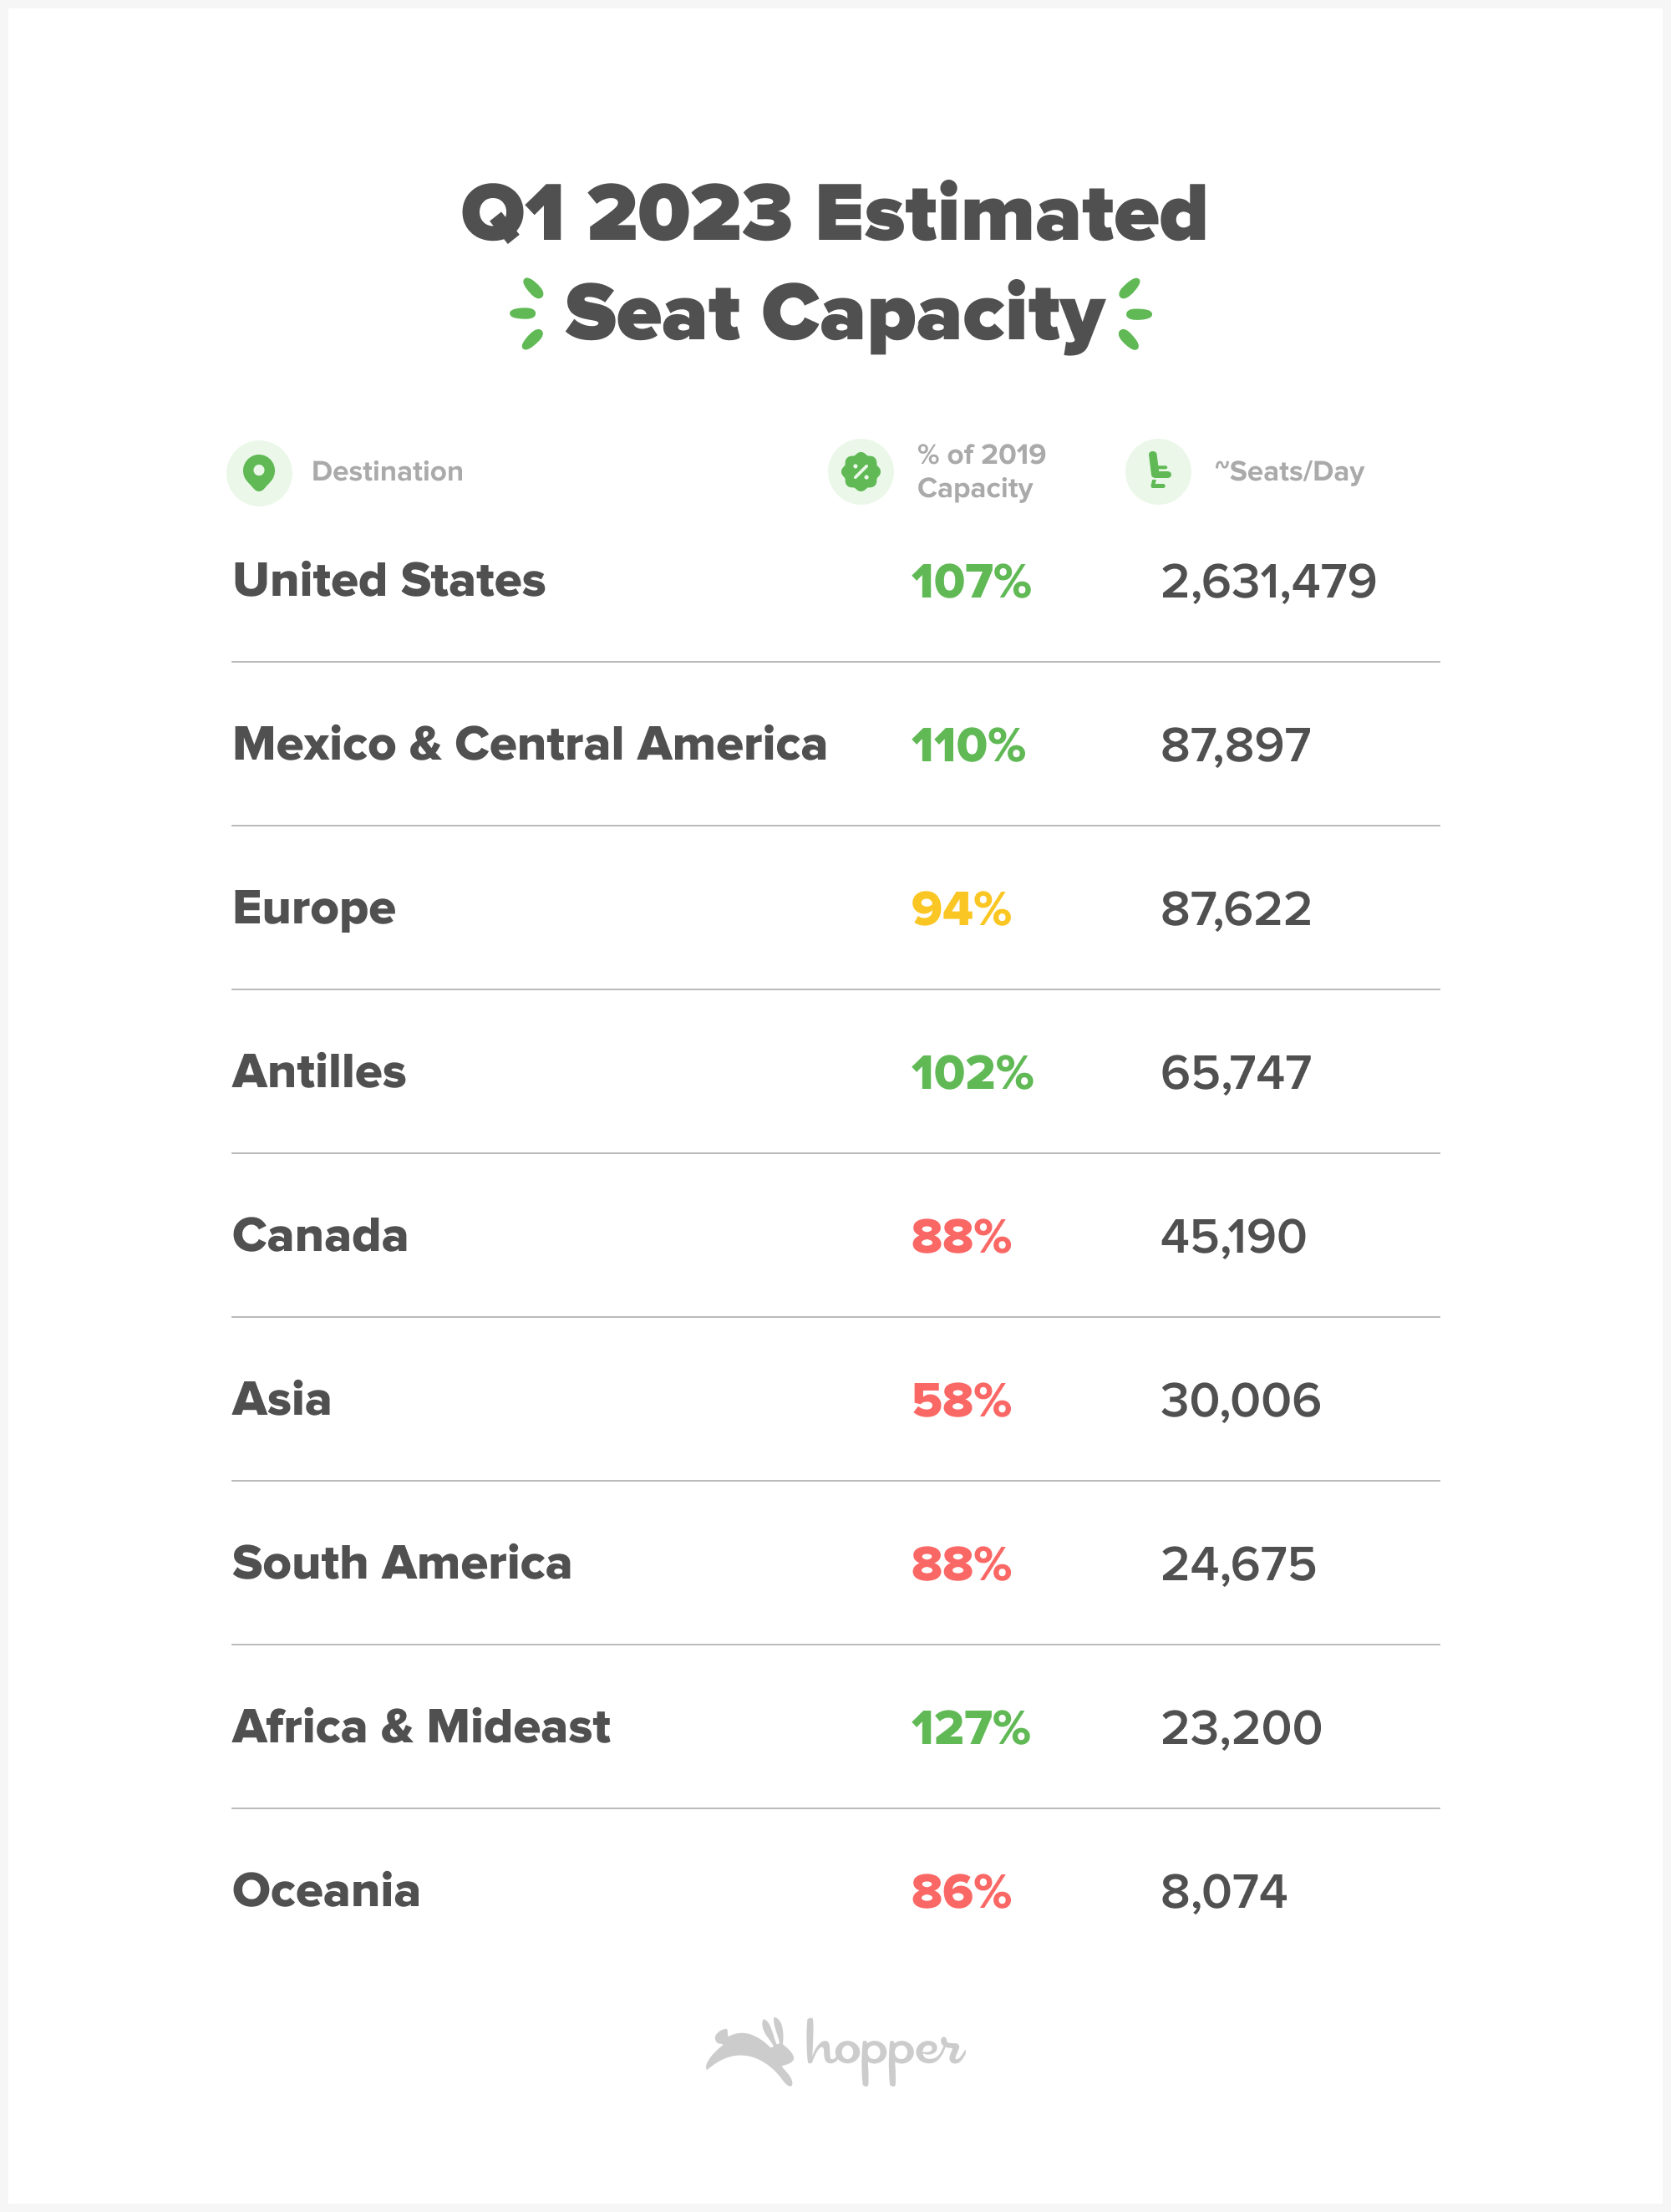
Europe remains the highest demand international region followed by Asia, which has seen a 10% point increase in share from lows in 2021. Warm weather destinations spanning Mexico, Central America and the Antilles combined capture ~20% of international search demand from the U.S, and seat capacity here has surpassed 2019 levels already. Airfare to most regions has increased compared to 2019, as higher demand, higher costs from inflation and jet fuel and lower supply continue to plague the market.
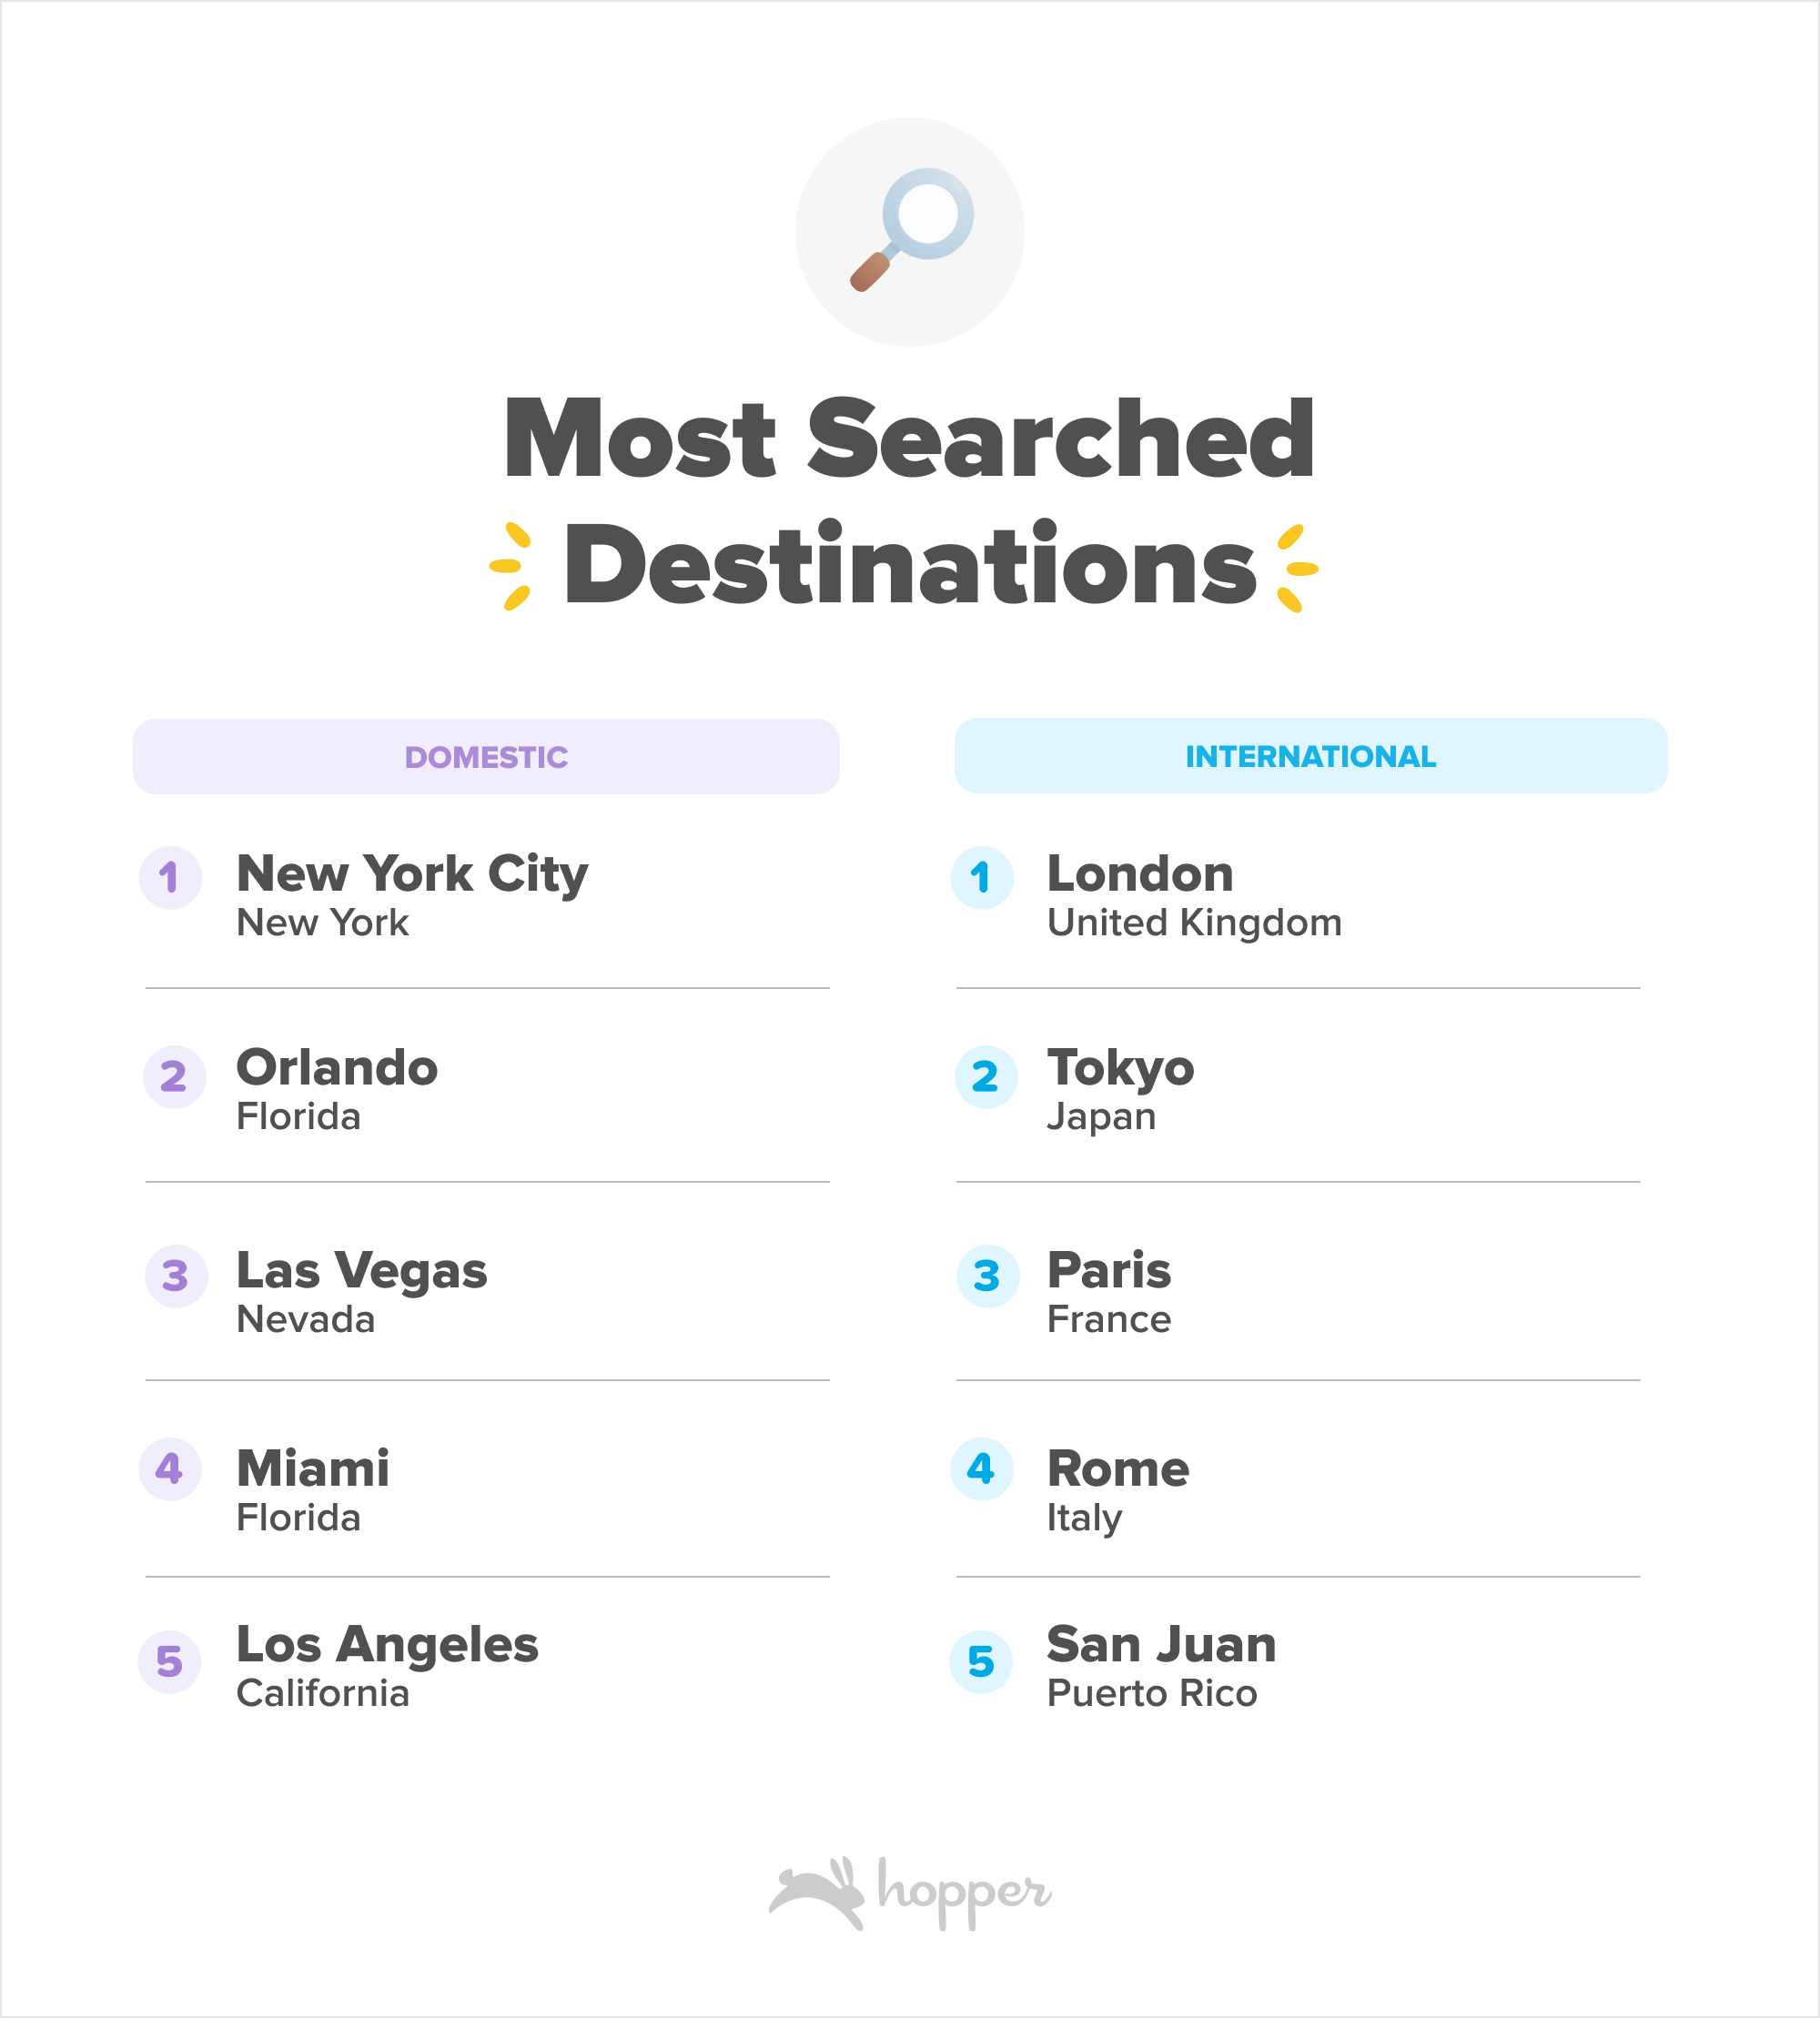
Among domestic destinations, big U.S cities remain the most popular destinations for Americans. New York City tops the list as the most searched domestic destination, followed by Orlando (think Disney & Port of Orlando Cruises!) and Las Vegas. The most searched international destination is London, followed by Tokyo, Paris and Rome.
Flight Capacity Recovery
As demand has surged for travel in the last 18 months, airlines have hurried to rebuild networks which were brought to a standstill in 2020. Today, airlines are still operating fewer flights than pre-pandemic but have traded out smaller jets for larger ones to increase their available seat capacity while operating in a resource constrained environment. Domestic seat capacity, which surpassed 2019 levels on a few dates in 2022, has kicked off 2023 with estimated seat capacity surpassing 2019 levels by 7% in the first three months of the year.
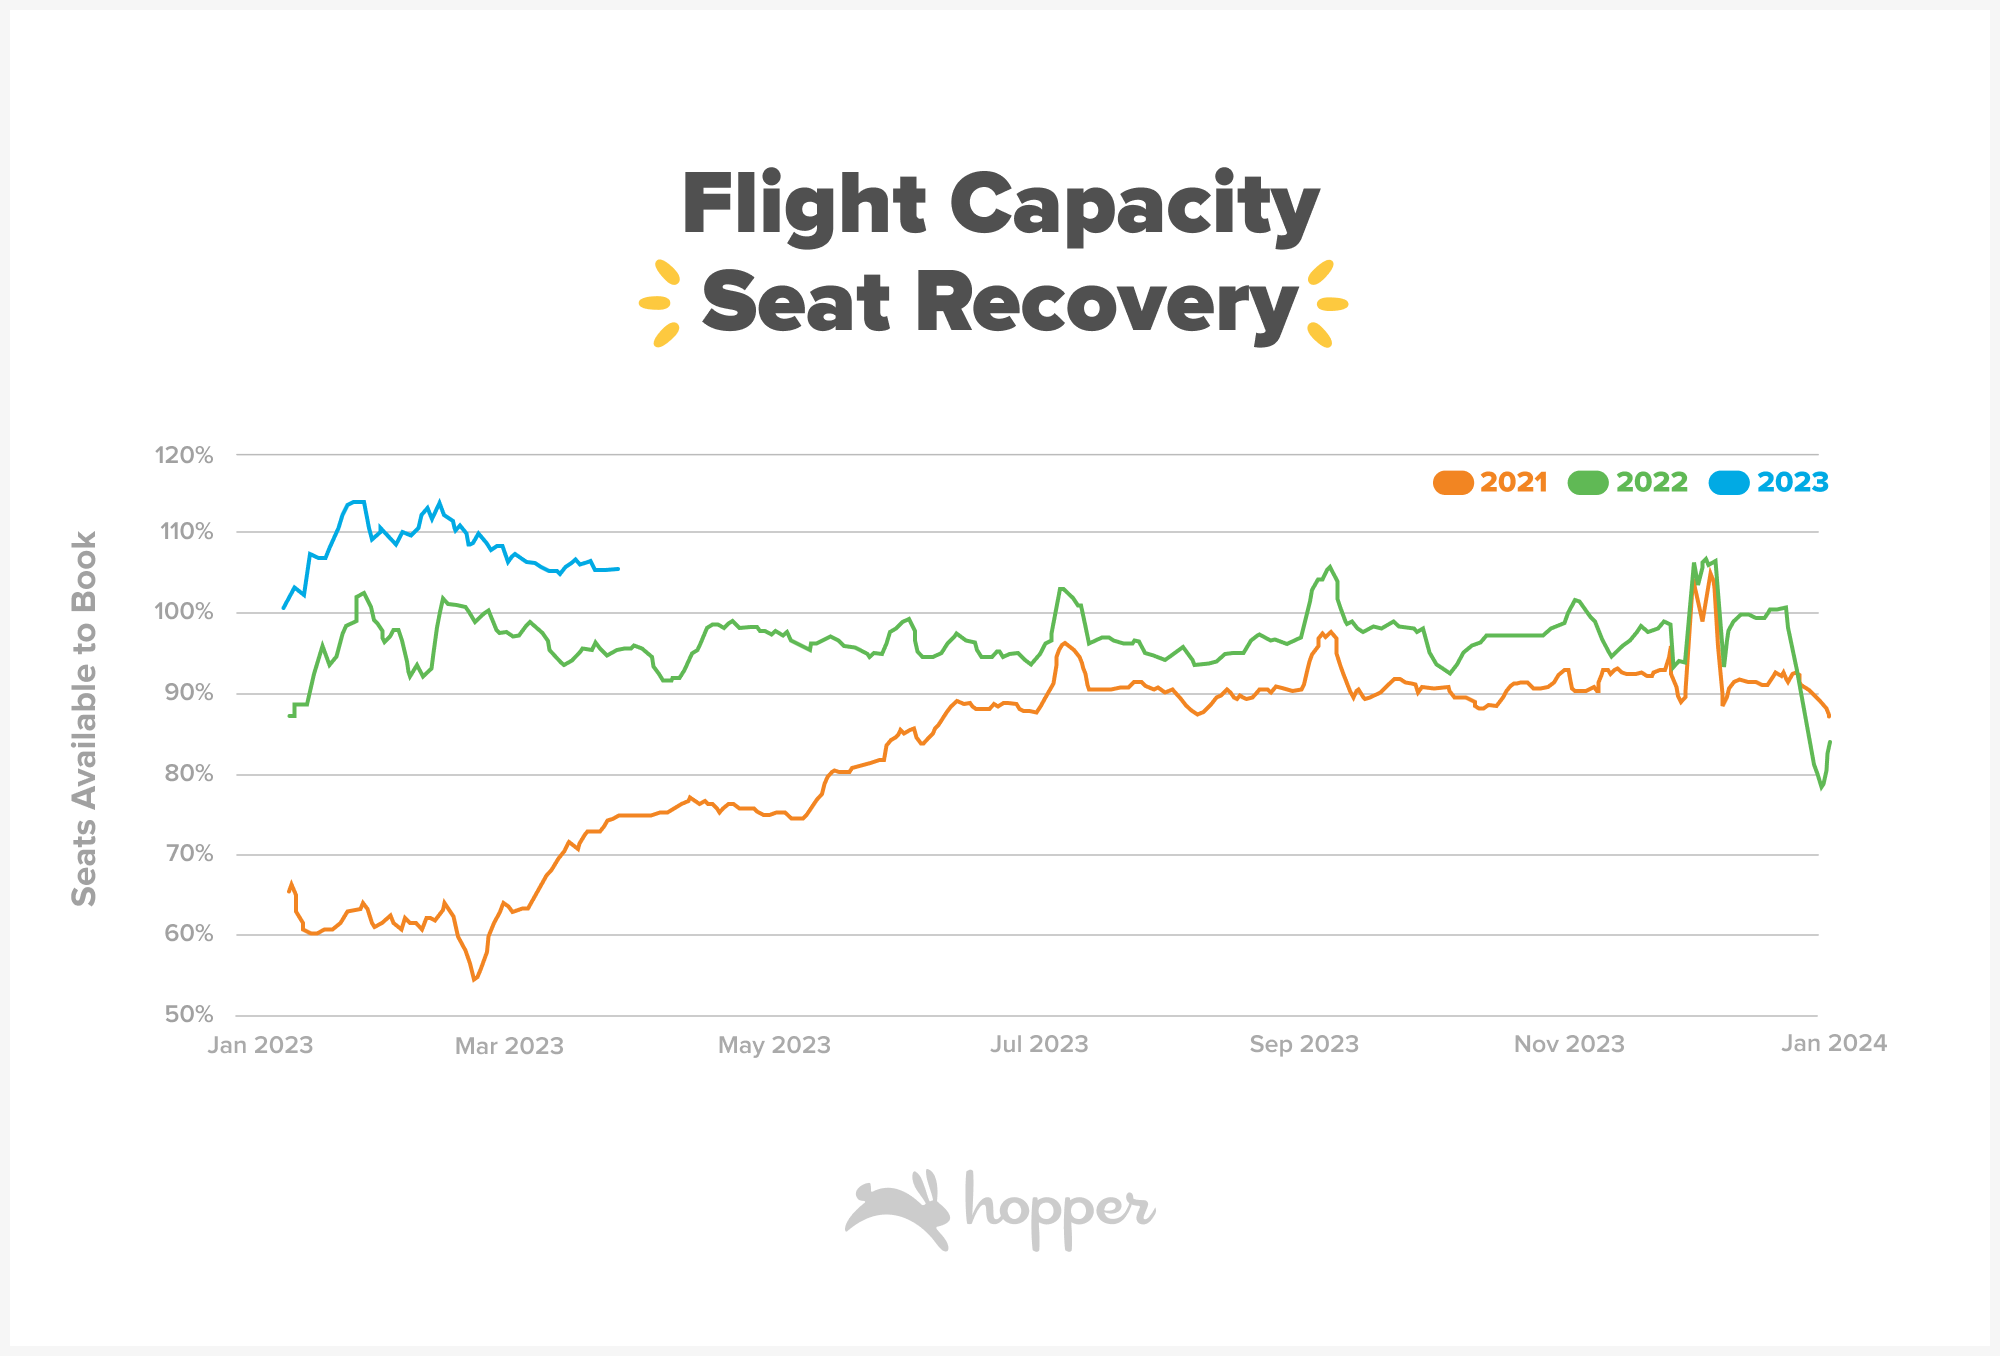
Figure: Estimated seats available to book on domestic routes compared to the same week in 2019. From OAG.
Though demand to international destinations has recovered, flight capacity to some international regions still has a ways to go before fully recovering. Today, seat capacity to Mexico, Central America, Antilles, Africa and the Mideast have recovered to above 2019 levels. By comparison, capacity to Canada, South America and OCeania remain just below 90% of 2019 levels. Asia, which reopened later than most other regions of the world, lags behind with just 58% of seat capacity returned in the first quarter of the year. This transpacific capacity is likely to continue recovering in 2023, pushed by the reopening of China late last year.
Europe, the highest demand region for international travelers from the U.S, has recovered 94% of estimated seats, up from 82% in 2022. With demand to Europe expected to surge again this summer and fall, airlines are likely to continue rebuilding transatlantic networks to push seat capacity over 2019 levels on peak dates.
Trending Destinations for 2023
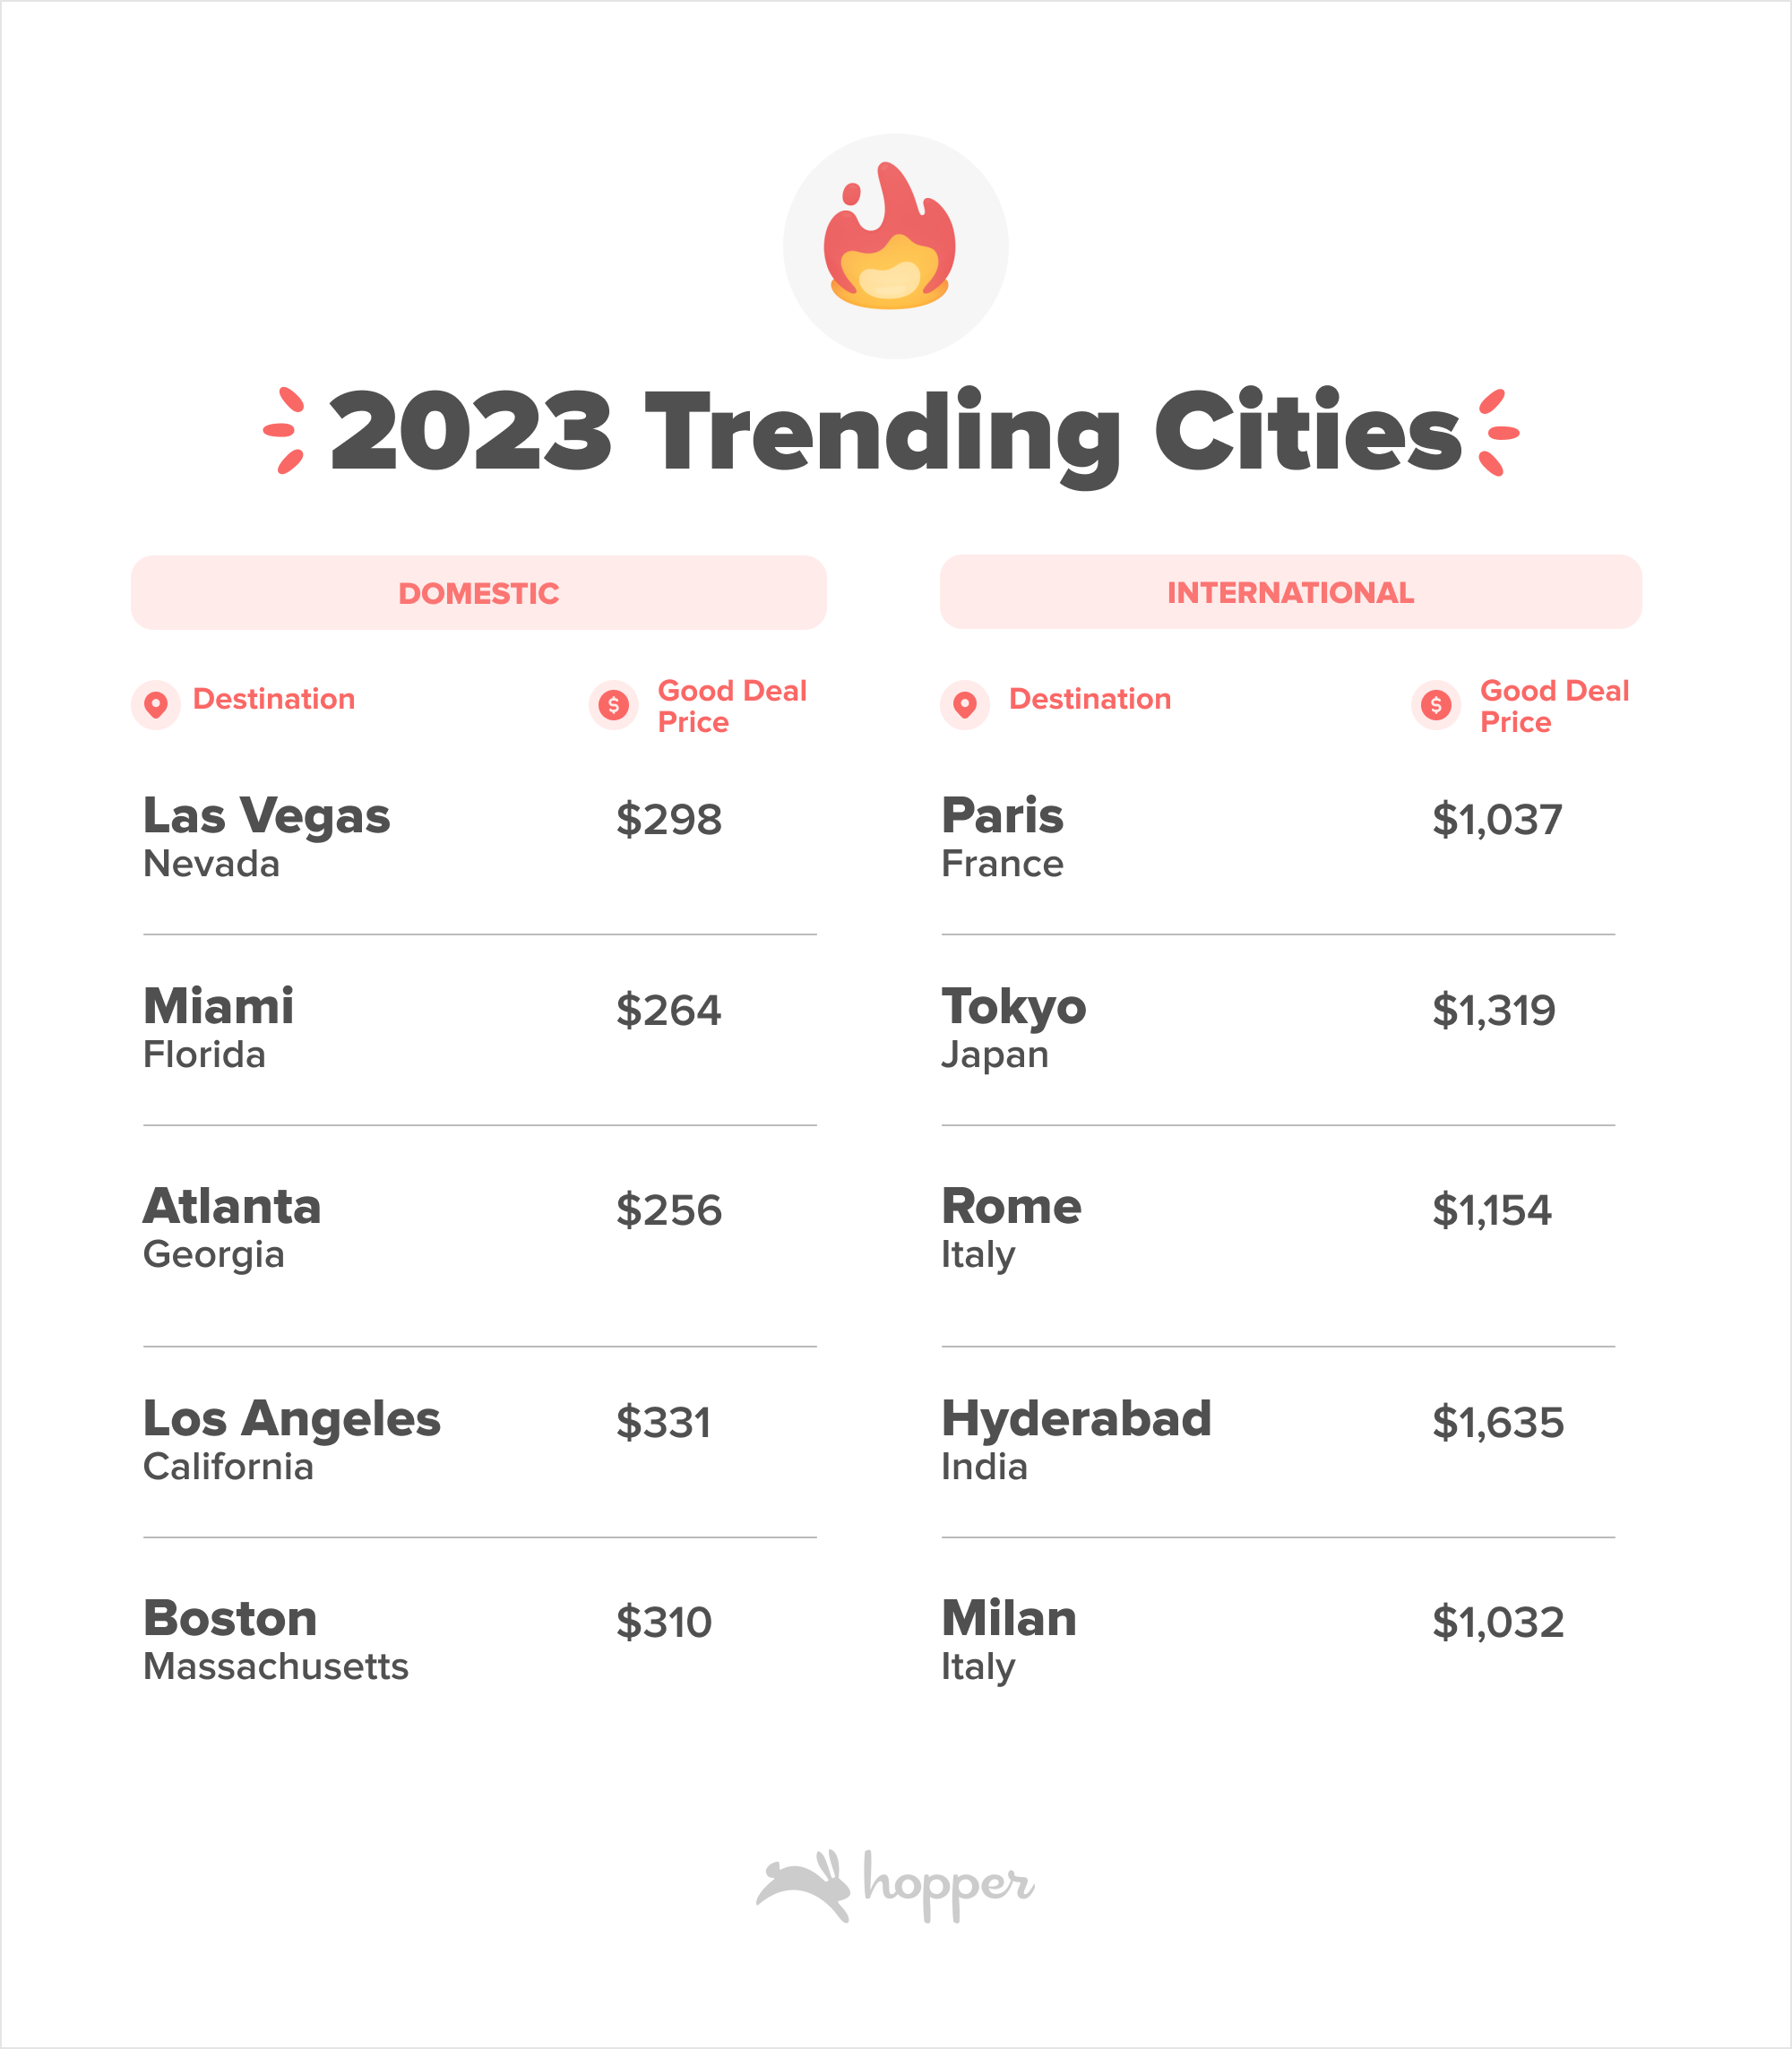
2023 is set to be another big year for travel, with destinations both domestically and abroad surging in demand. We’ve rounded up destinations trending the most for 2023 trips, both big and small!
Trending Major City Destinations
Travelers headed to big cities in the U.S are looking for warmer weather, with 4 out of the top 5 offering temperature to hot climates. Las Vegas and Miami remain top trending destinations into the new year, offering a combination of warm weather and vibrant nightlife. Paris, Tokyo and Rome are the top trending international cities this year, all averaging just over $1,000 per ticket.
Trending Destinations, off the beaten path
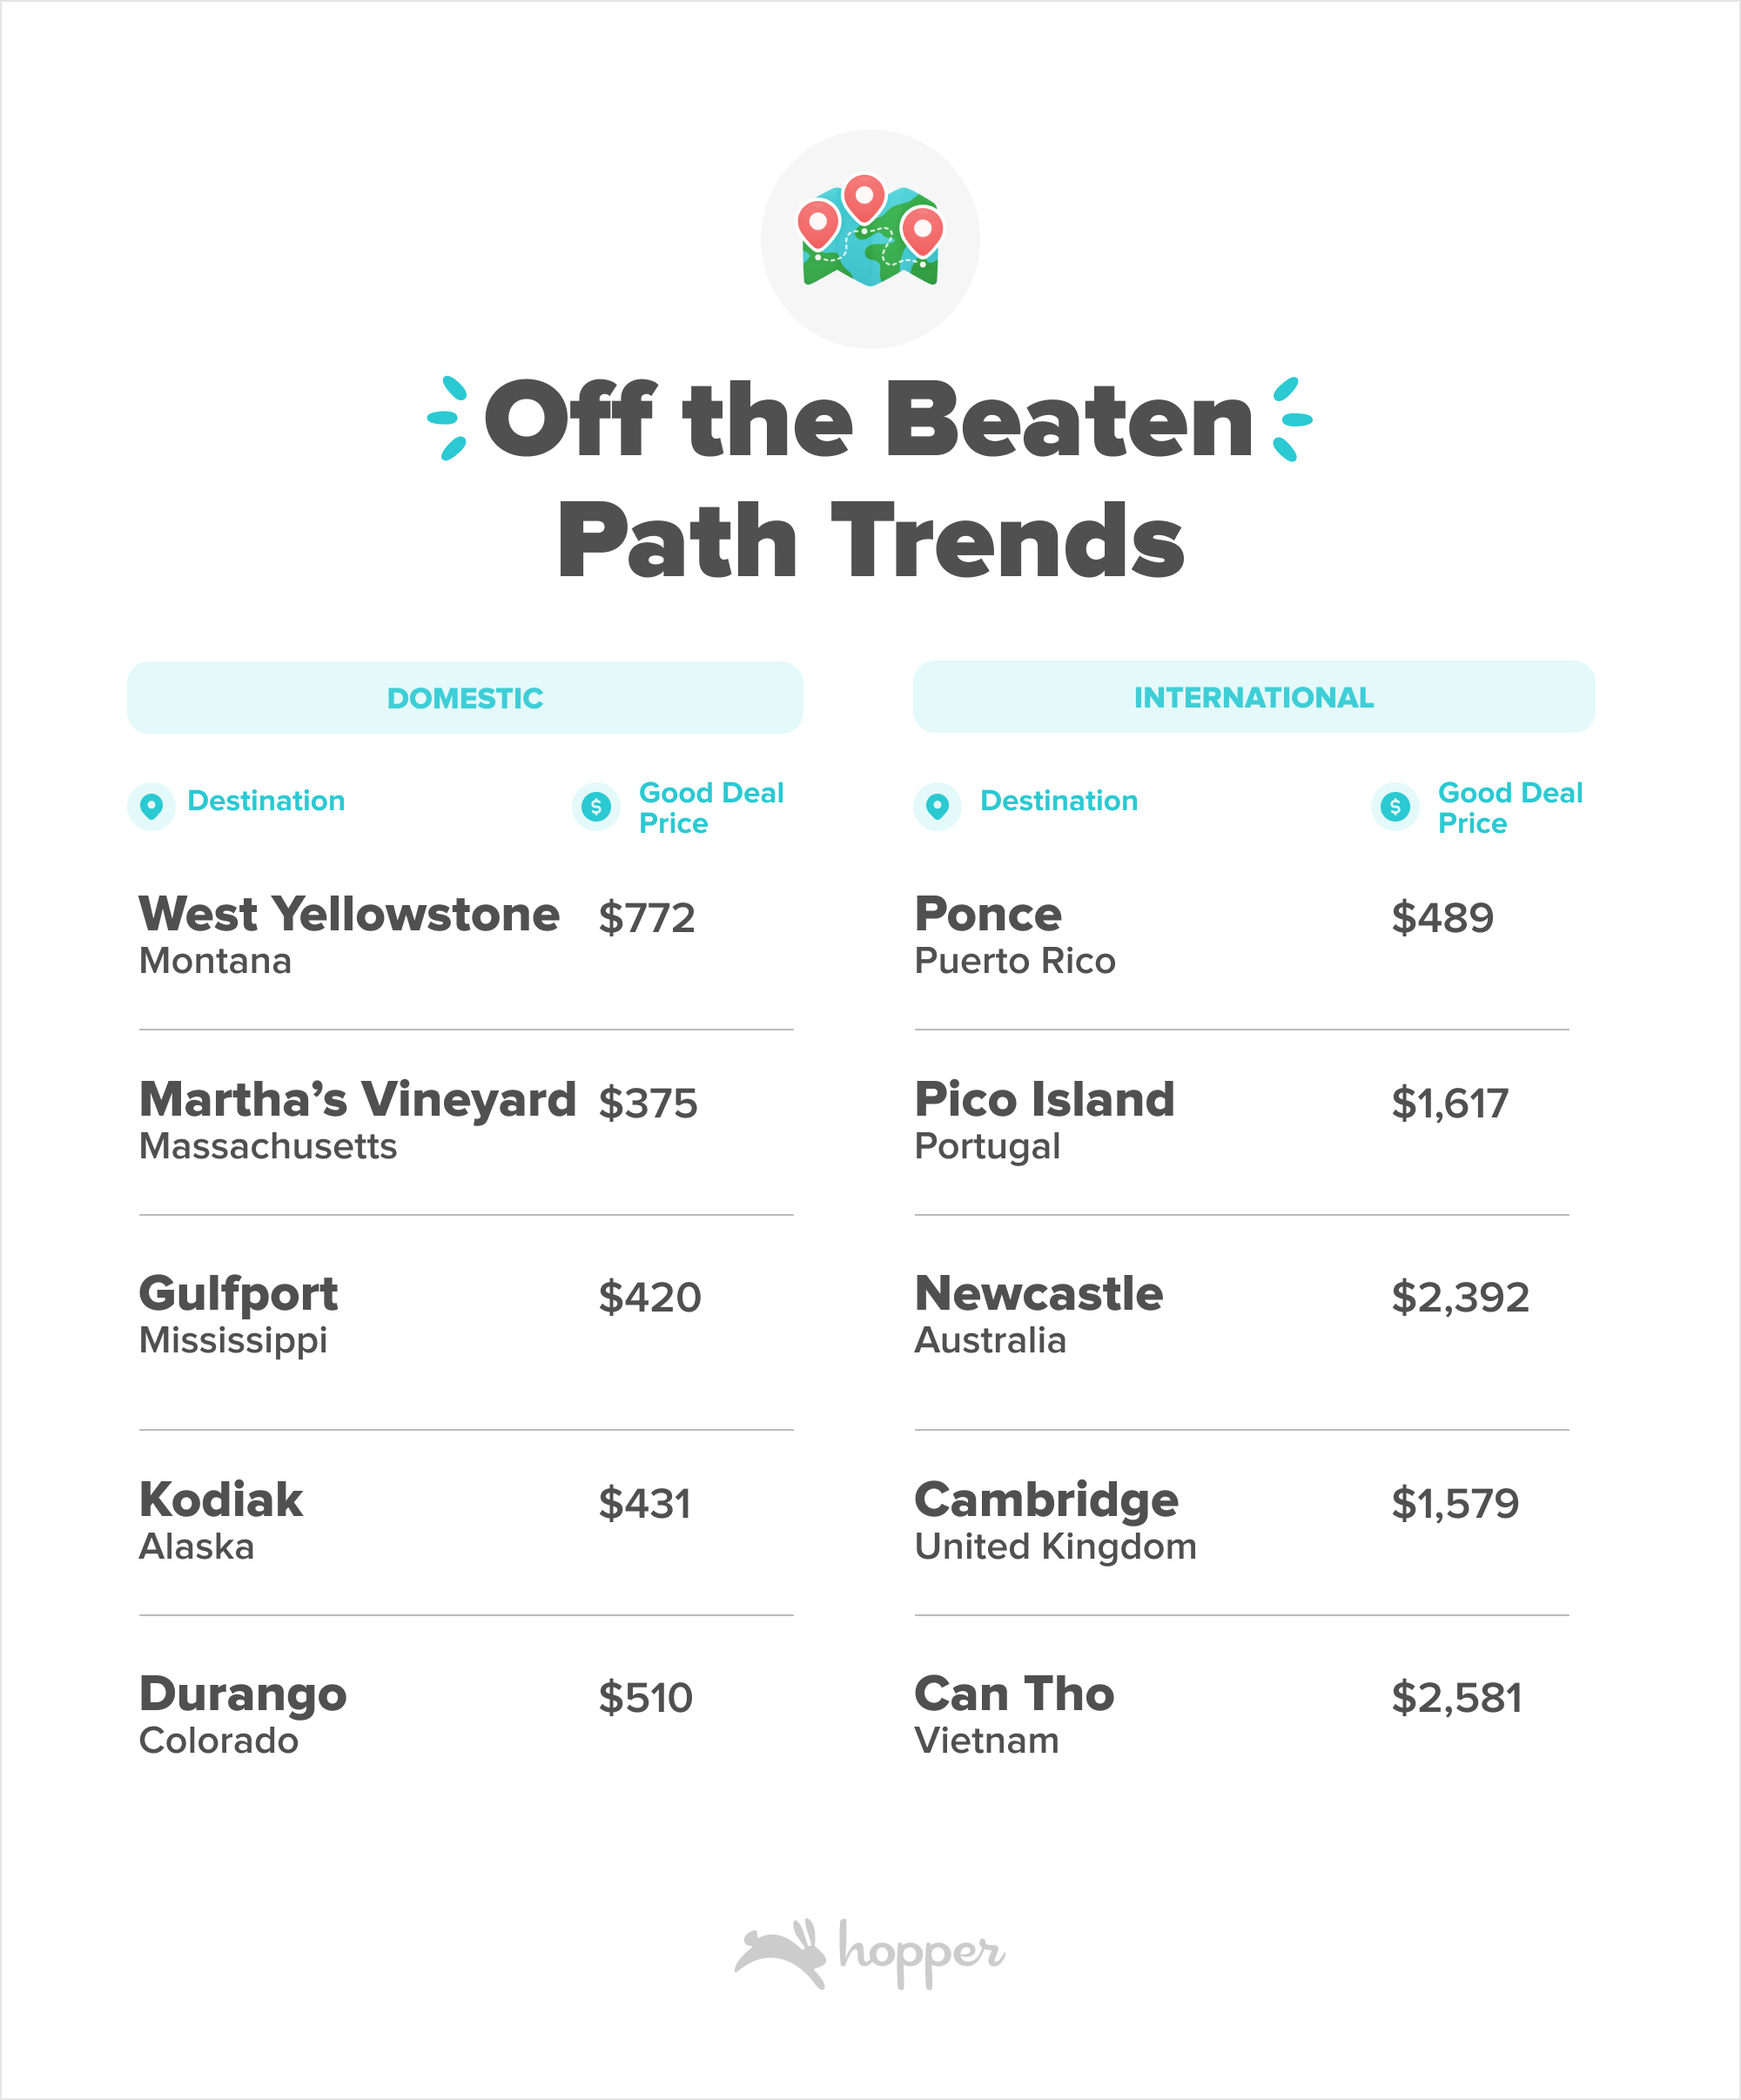
Though big cities are always in high demand, we’ve rounded up smaller, more off the beaten path destinations that have seen outsized increases in demand compared to pre-pandemic. In the U.S, the popular TV series Yellowstone has inspired trips to West Yellowstone and Durango, offering both scenic views, access to national parks and a range of outdoor experiences. Beachgoers are looking at trips to Martha’s Vineyard, a small island off the coast of Massachusetts, and Gulfport, Mississippi, seated right on the Gulf of Mexico.
International destinations off the beaten path are trending up as well, with the beaches in Puerto Rico, the Azores and Australia rising to make the top 5 trending destinations outside the U.S. Cambridge, UK and Can Tho, Vietnam have also surged in popularity compared to pre-pandemic.
Return to Asia
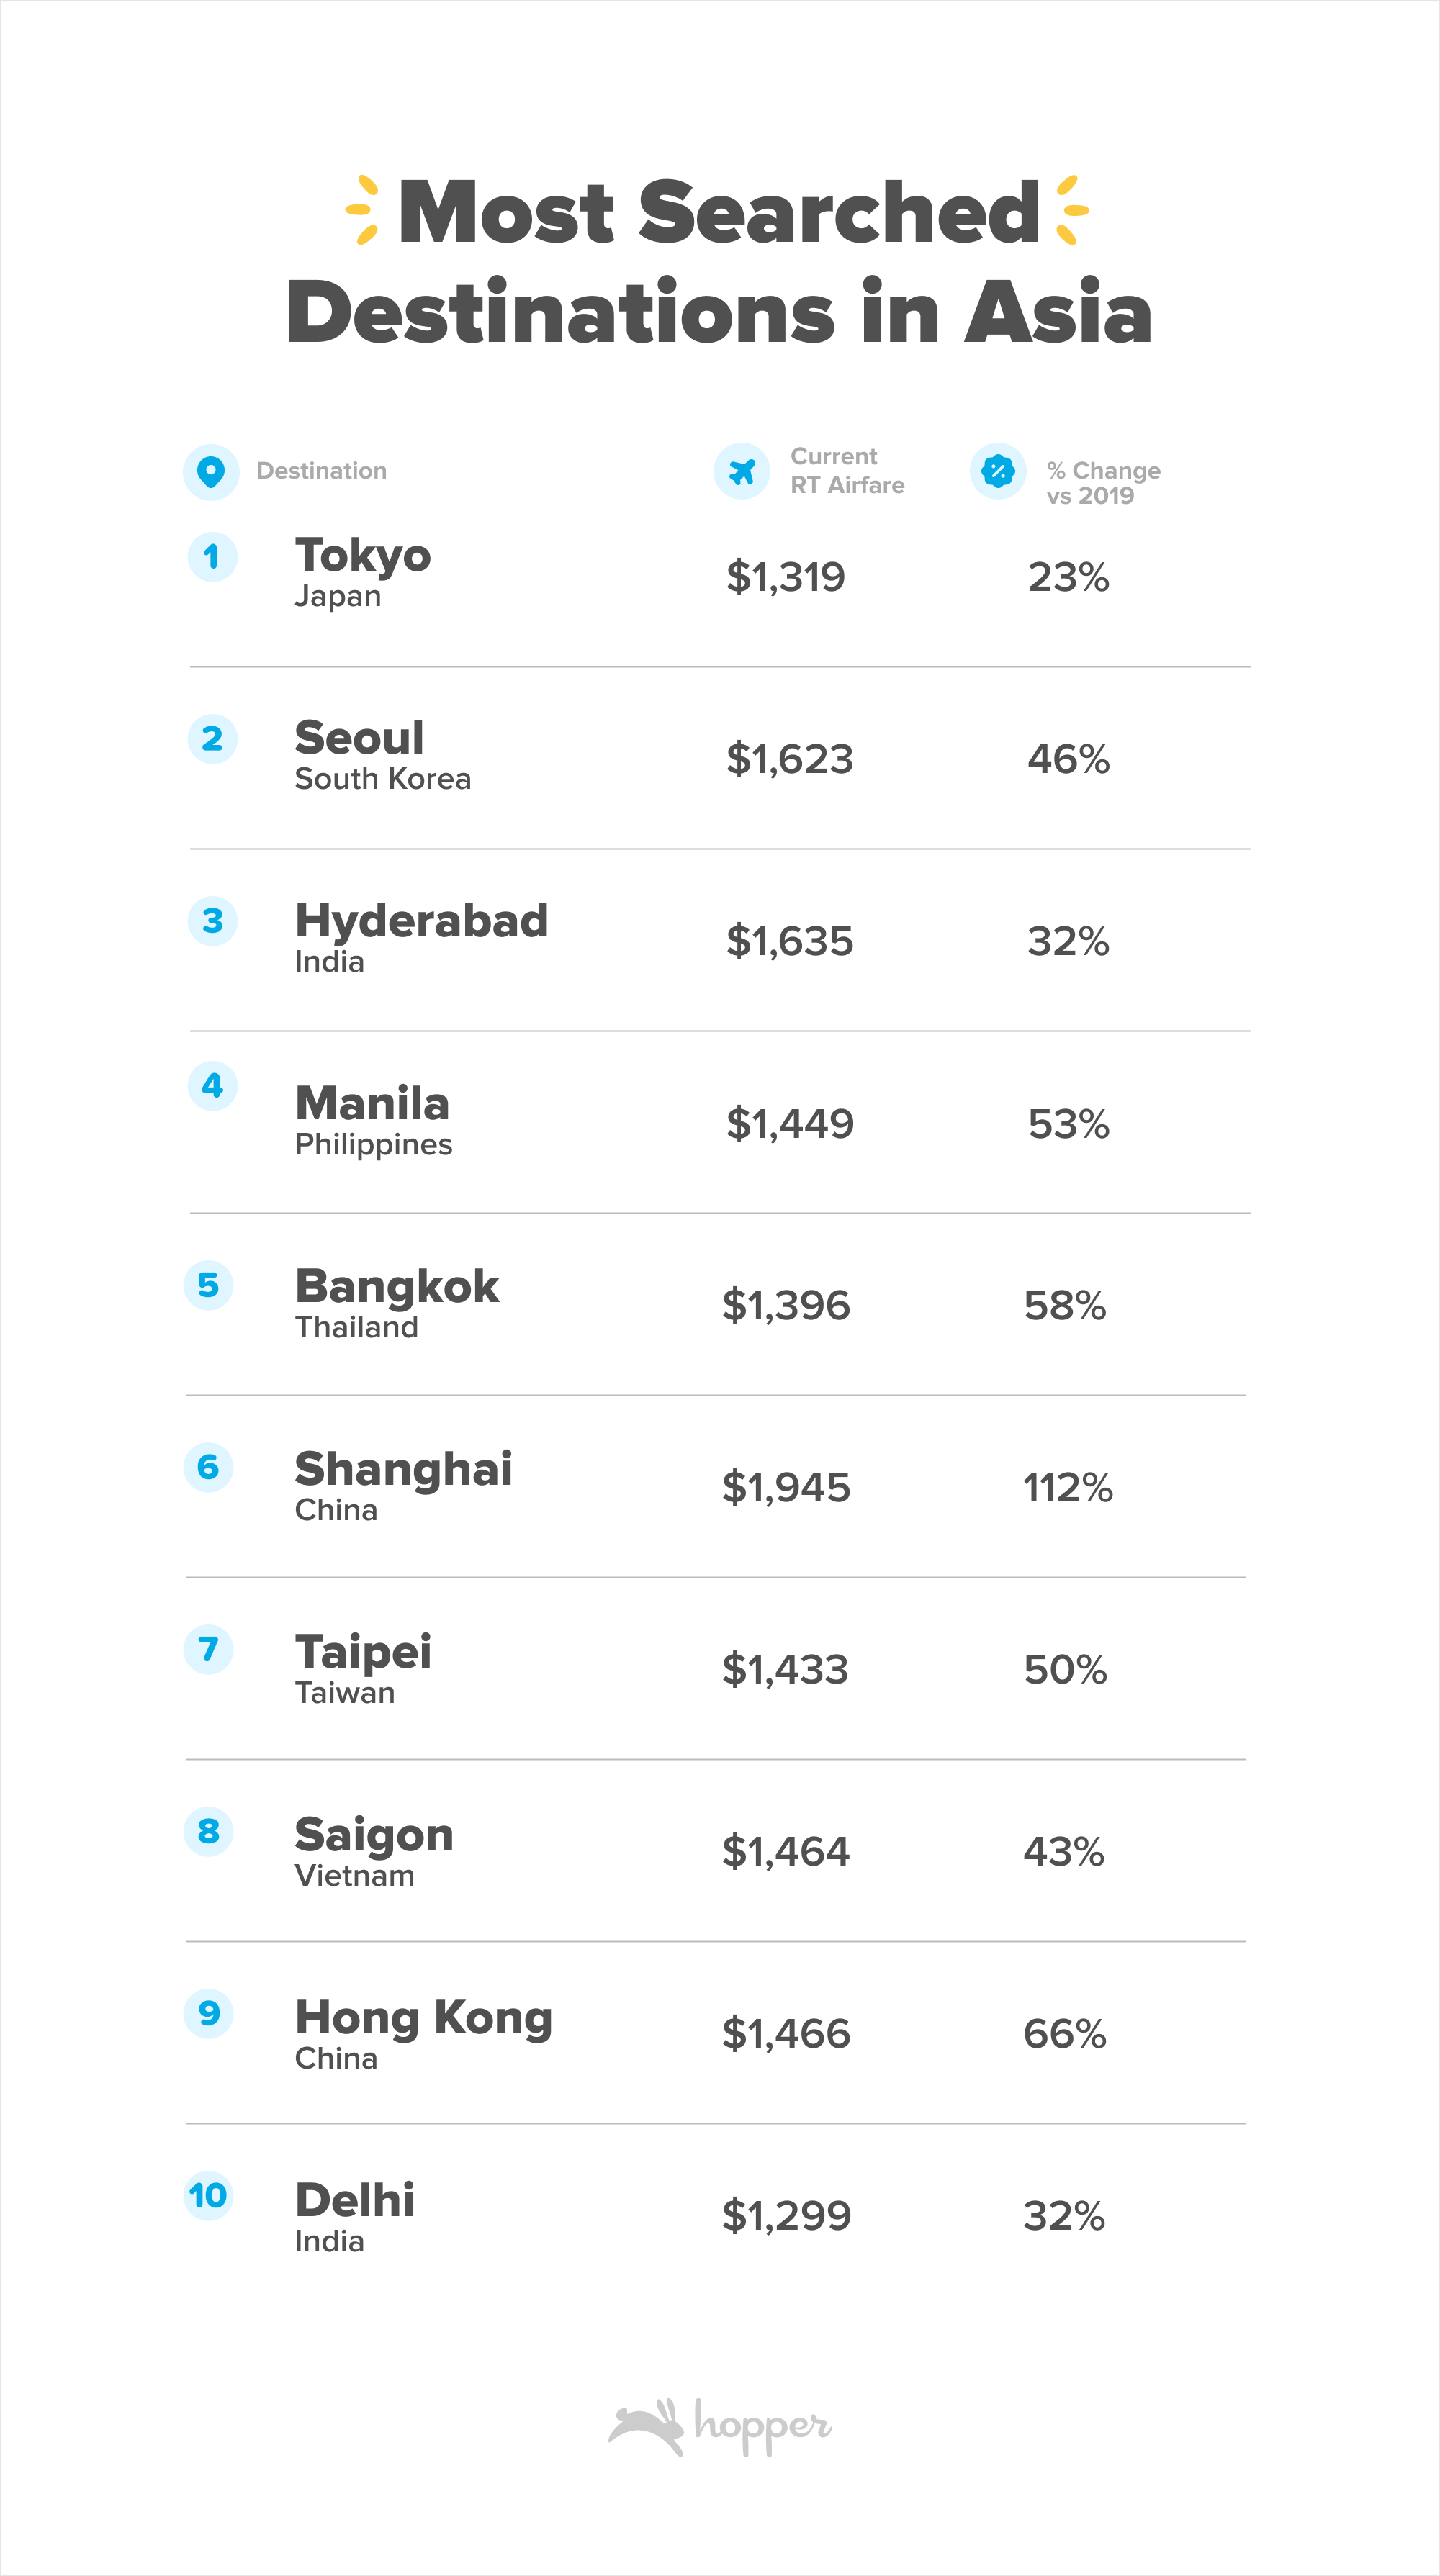
For much of the past three years, travel to major cities in Asia has been either impossible, or heavily restricted. As 2023 travel begins, Asia is experiencing its own renaissance. Nearly 75% of search demand to Asia is to destinations in Japan, India, China, Philippines and South Korea. Japan alone commands 24% of search demand from the U.S, followed by India at 19%. Top destinations are across the region – with Tokyo, Seoul and Hyderabad topping the ranking as the three most searched for Asian cities from the U.S.
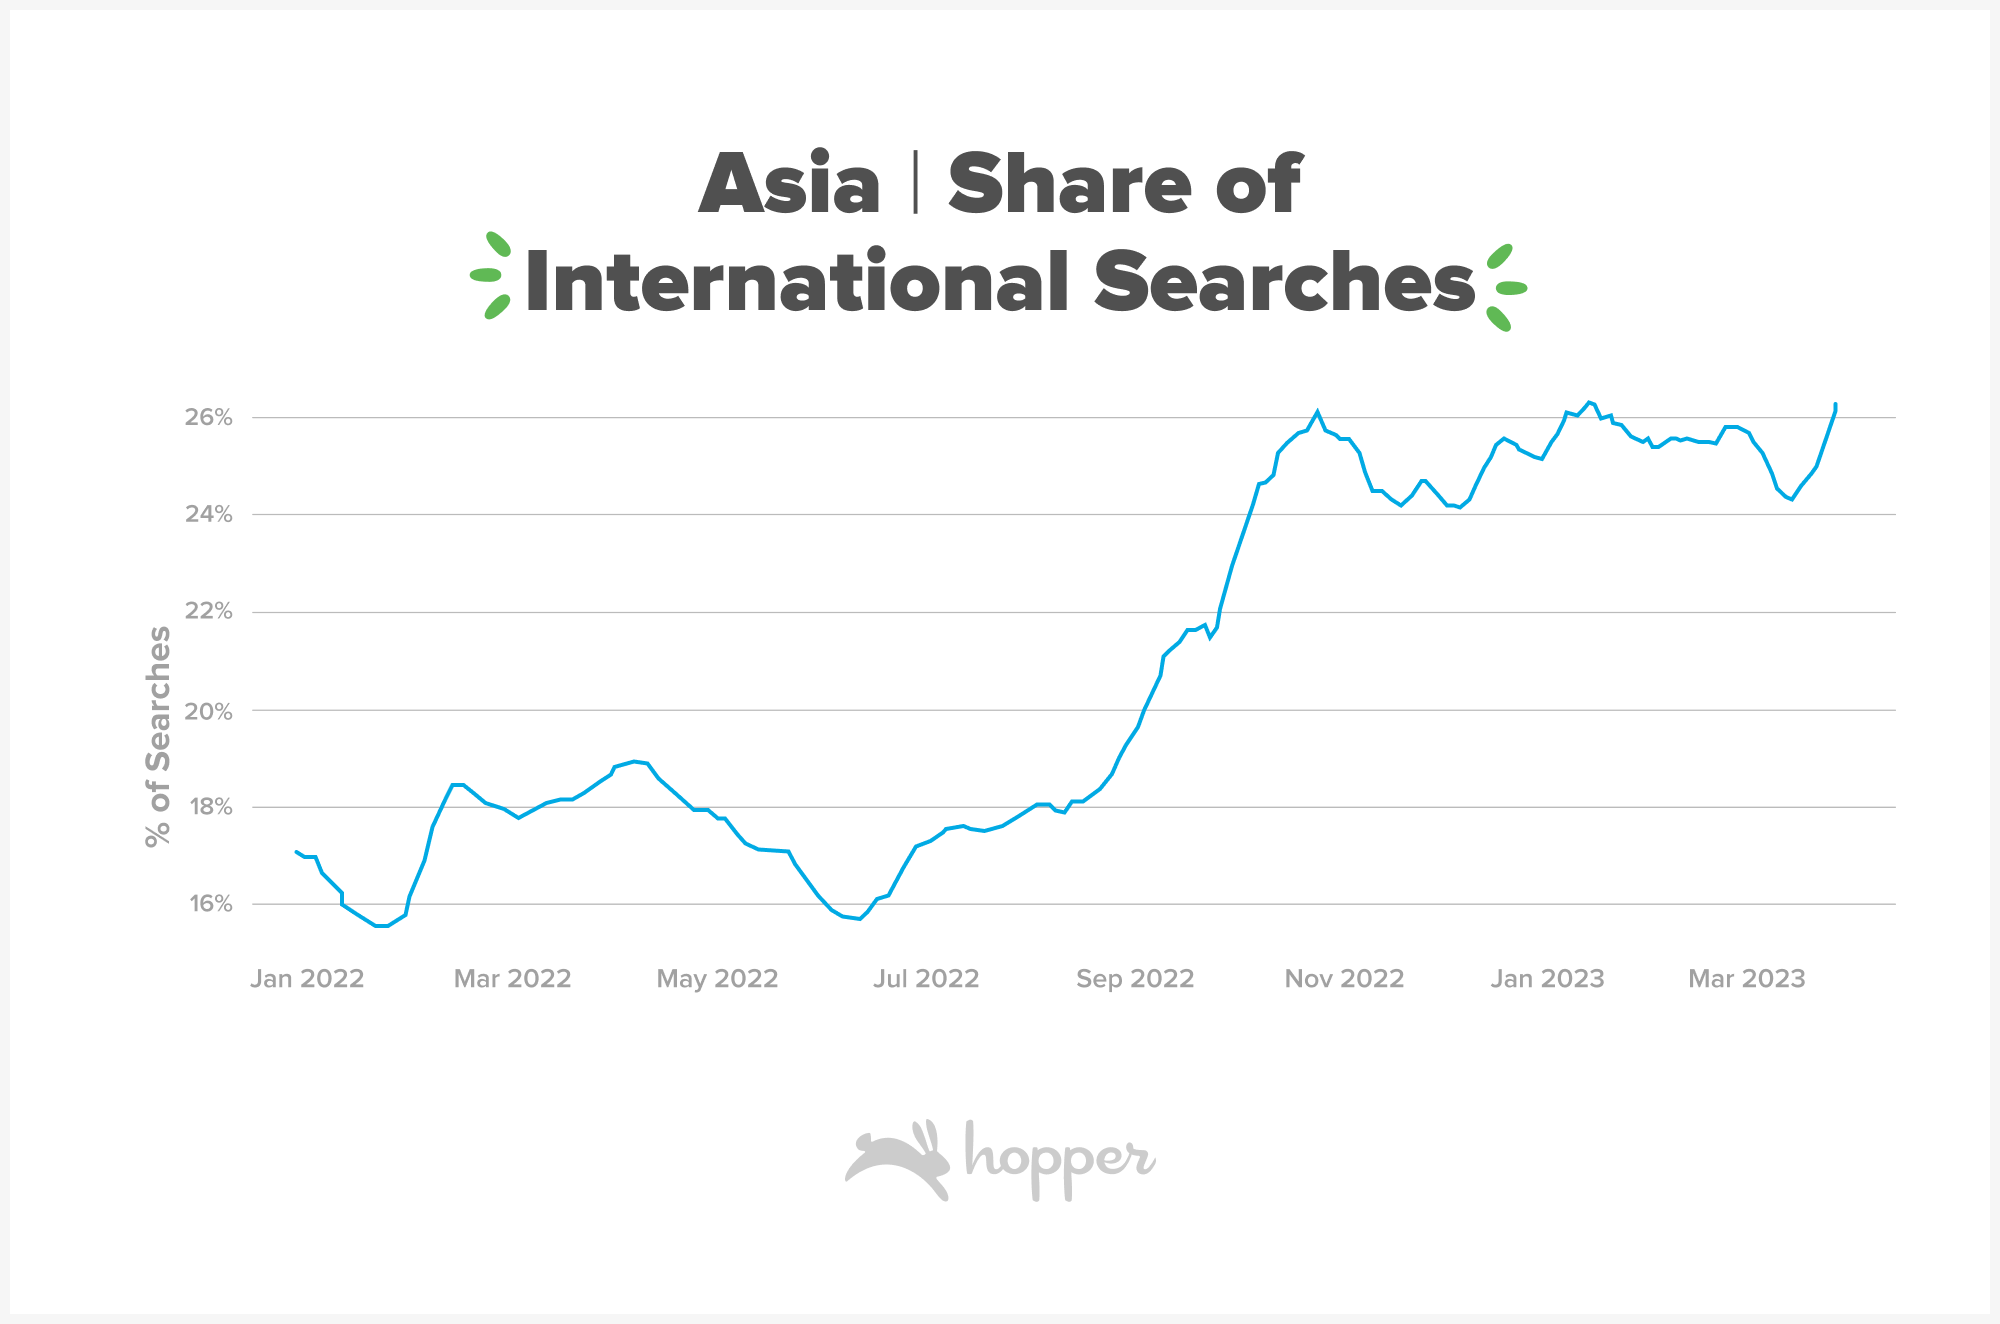
Search demand for flights to Asia began to surge in mid 2022, as many Asian countries loosened pandemic era travel restrictions and the U.S removed the testing entry requirement for Americans returning from international trips. Demand was buoyed later last year when China announced the end of its zero-COVID policies. In the space of just 4 months, demand for trips to Asia increased from representing 16% share of international searches to 26%, a 10% point increase. The demand has remained strong into 2023 as travelers plan vacations, trips home to see family and friends and even business travel.
Though demand to Asia has surged in the last 6-8 months, seat capacity has kept a steady, and slow, pace of recovery. Today, 58% of estimated seat capacity from the U.S direct to Asian destinations has been recovered compared to spring 2019. Capacity recovery to Asia is well behind the rest of the world, with all other regions recovered to 86% or more of pre-pandemic levels.
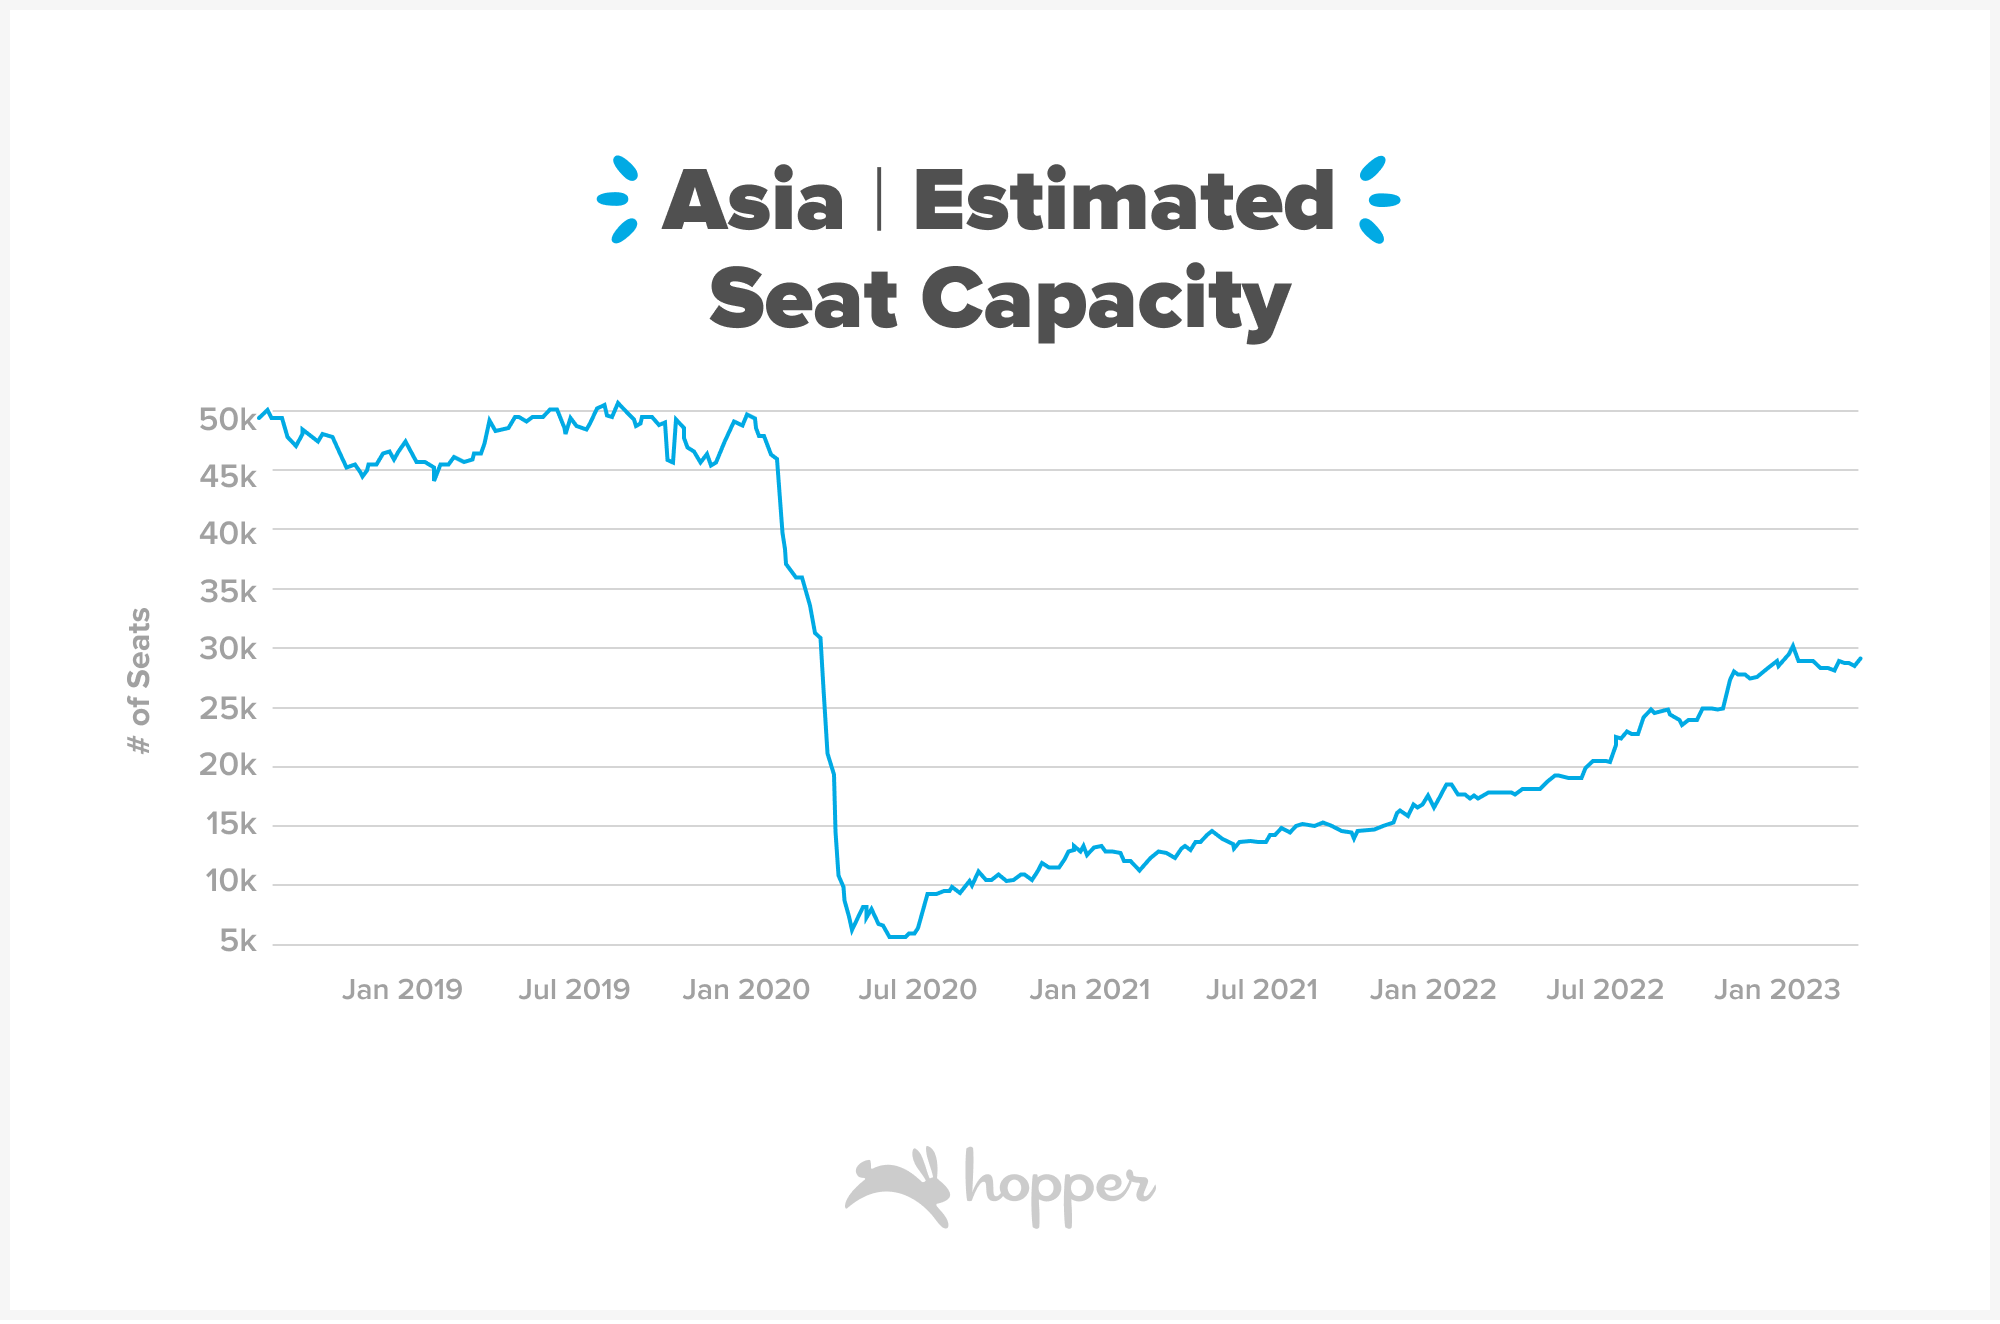
As capacity remains restricted across the pacific and demand continues to balloon, airfare to Asia will remain high this year. Airfare to the top destinations in Asia this year is already well above 2019 levels, with flights to Shanghai, China outpacing all other destinations with a price increase of 112% compared to pre-pandemic.
Consumer Spending
Millennials and Gen Z are spending more and traveling more.
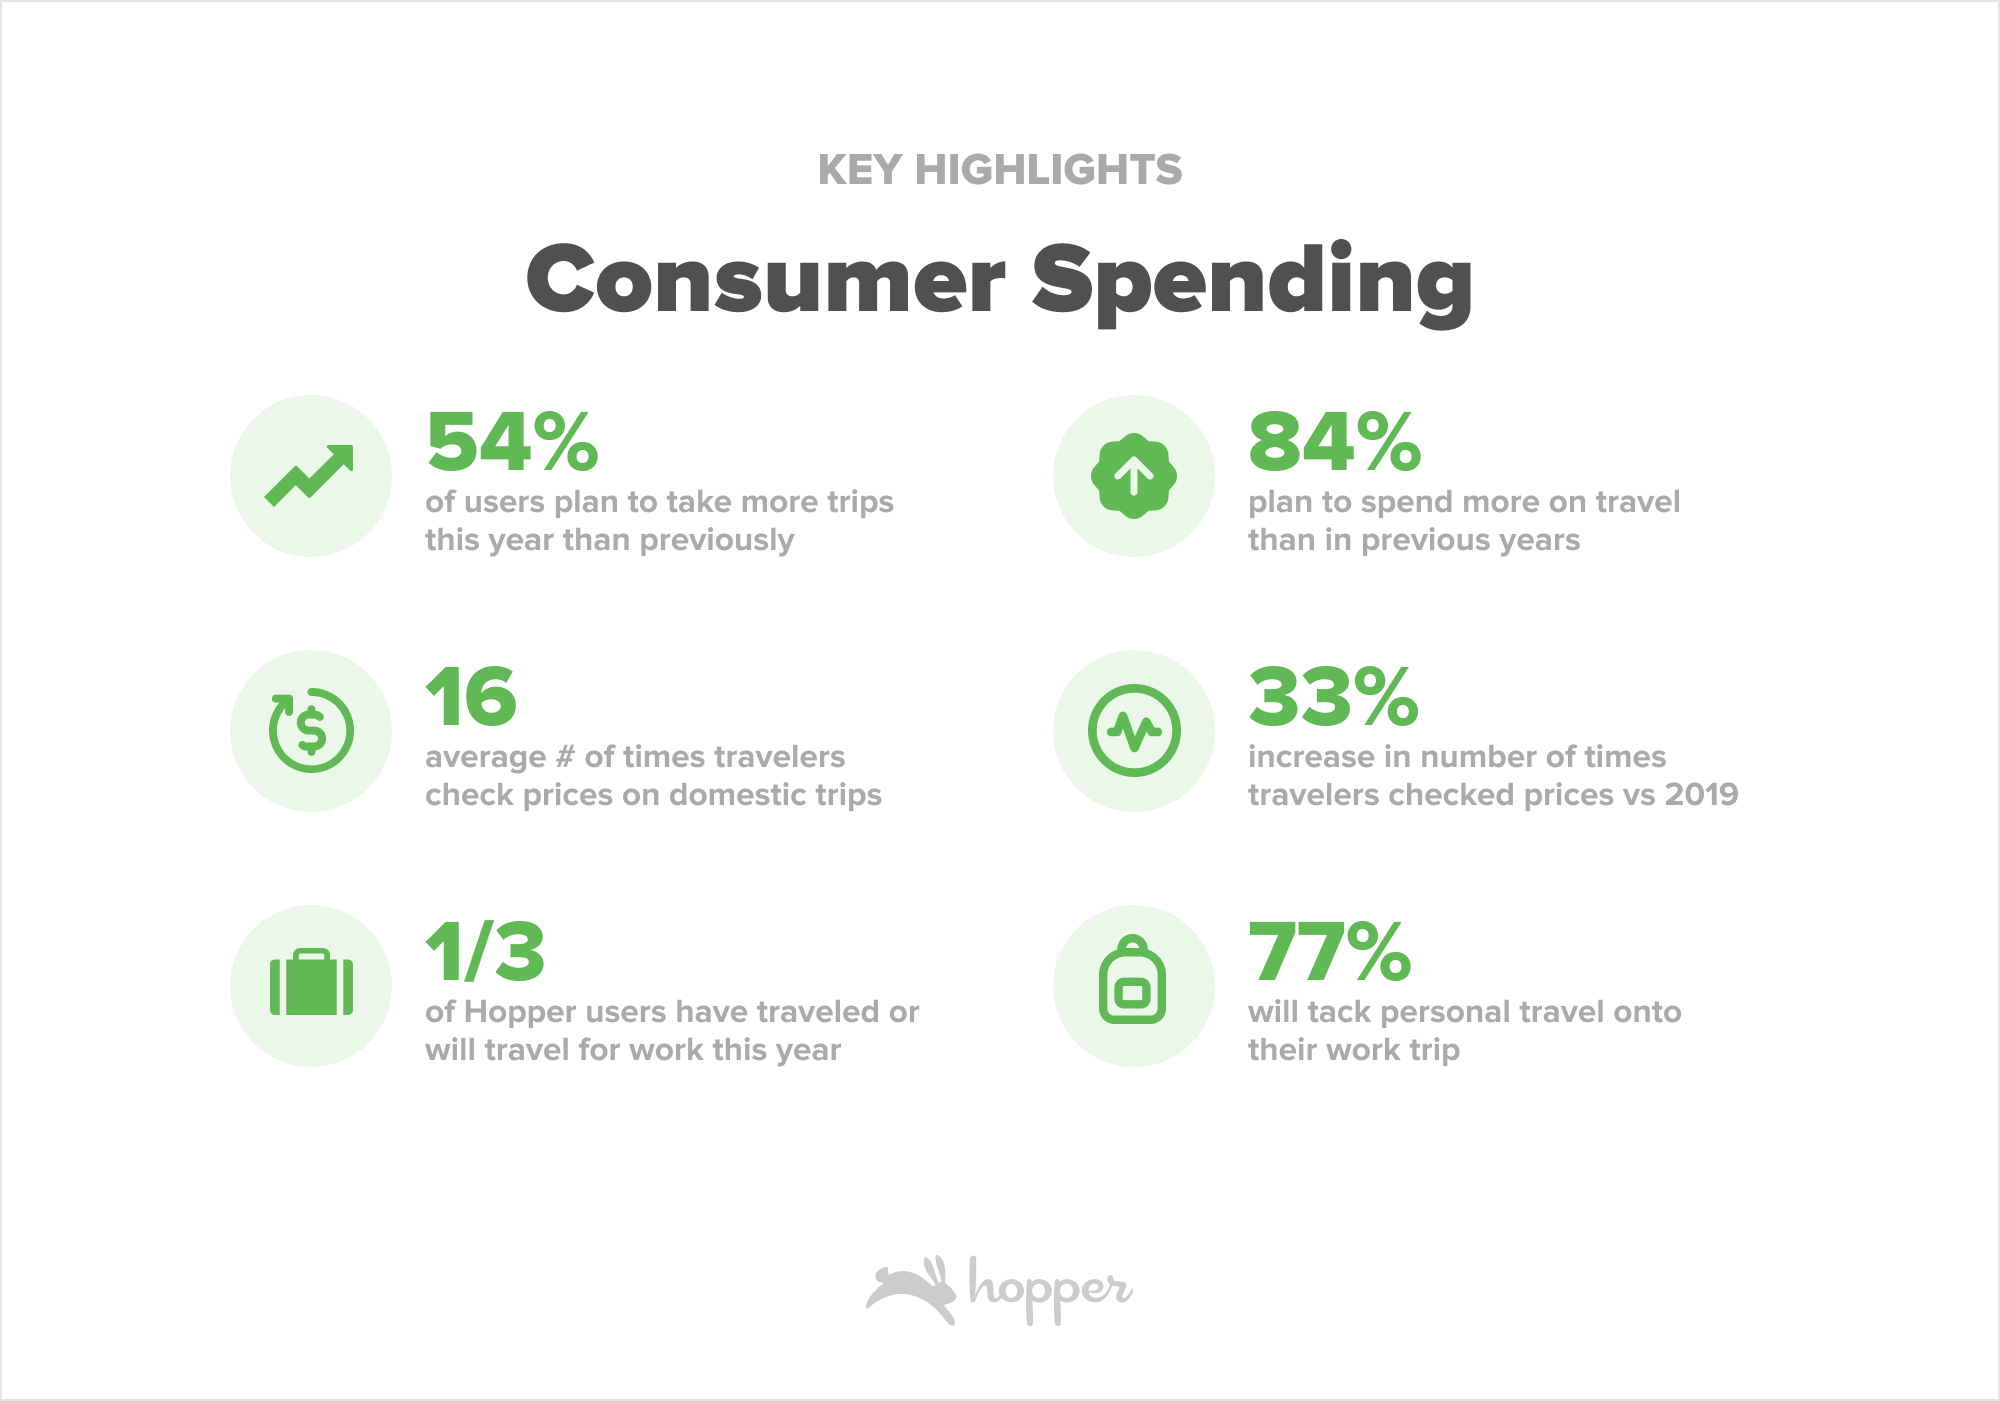
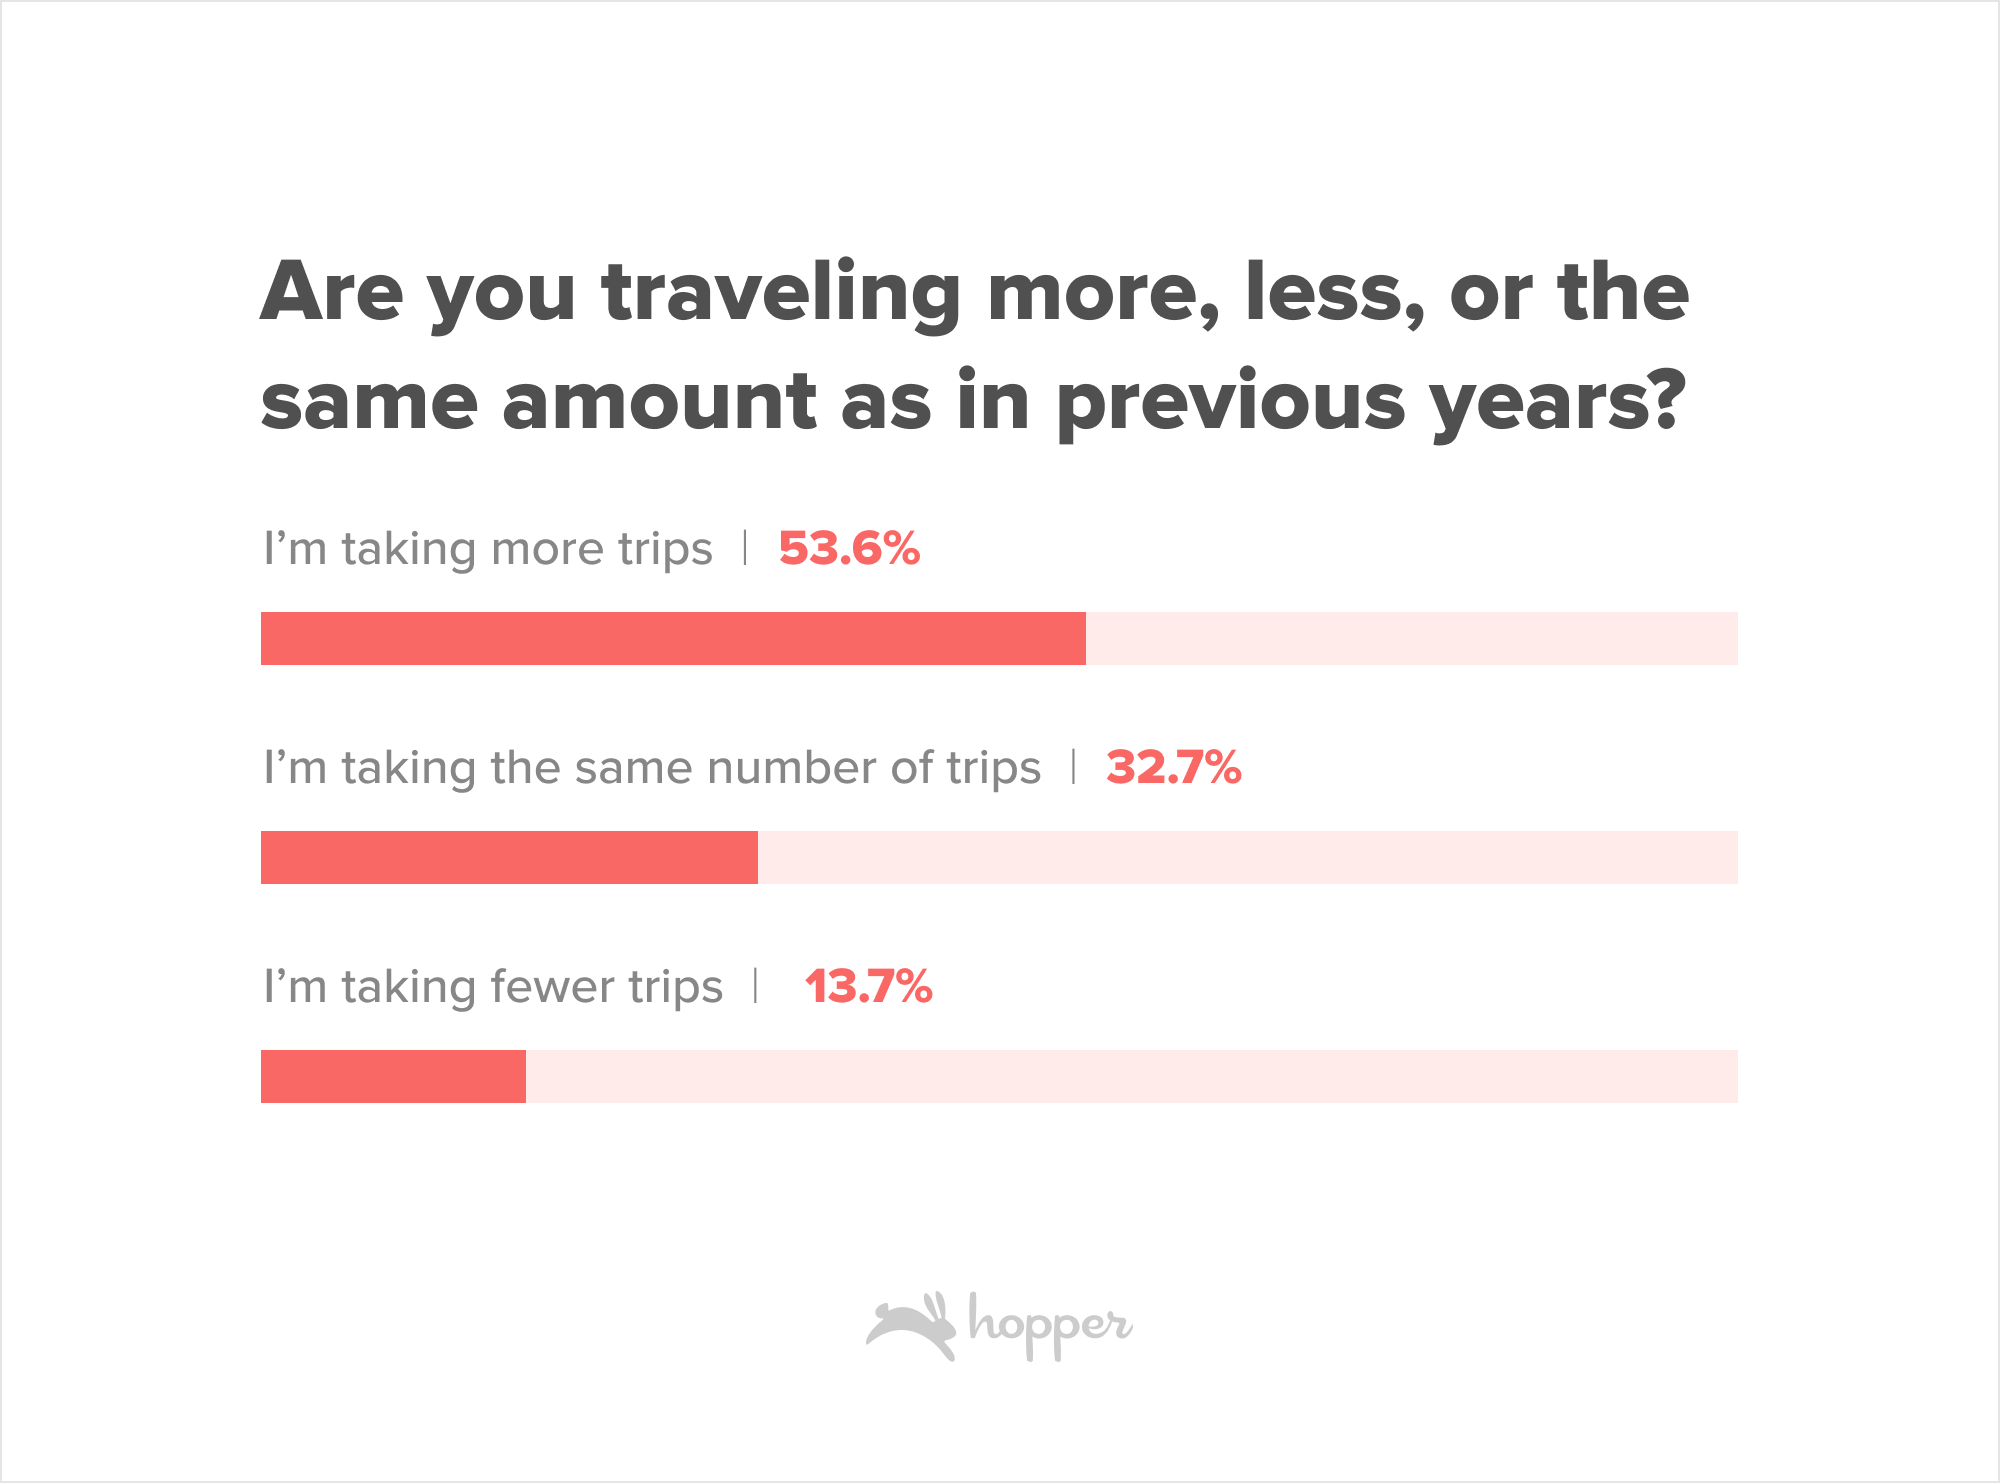
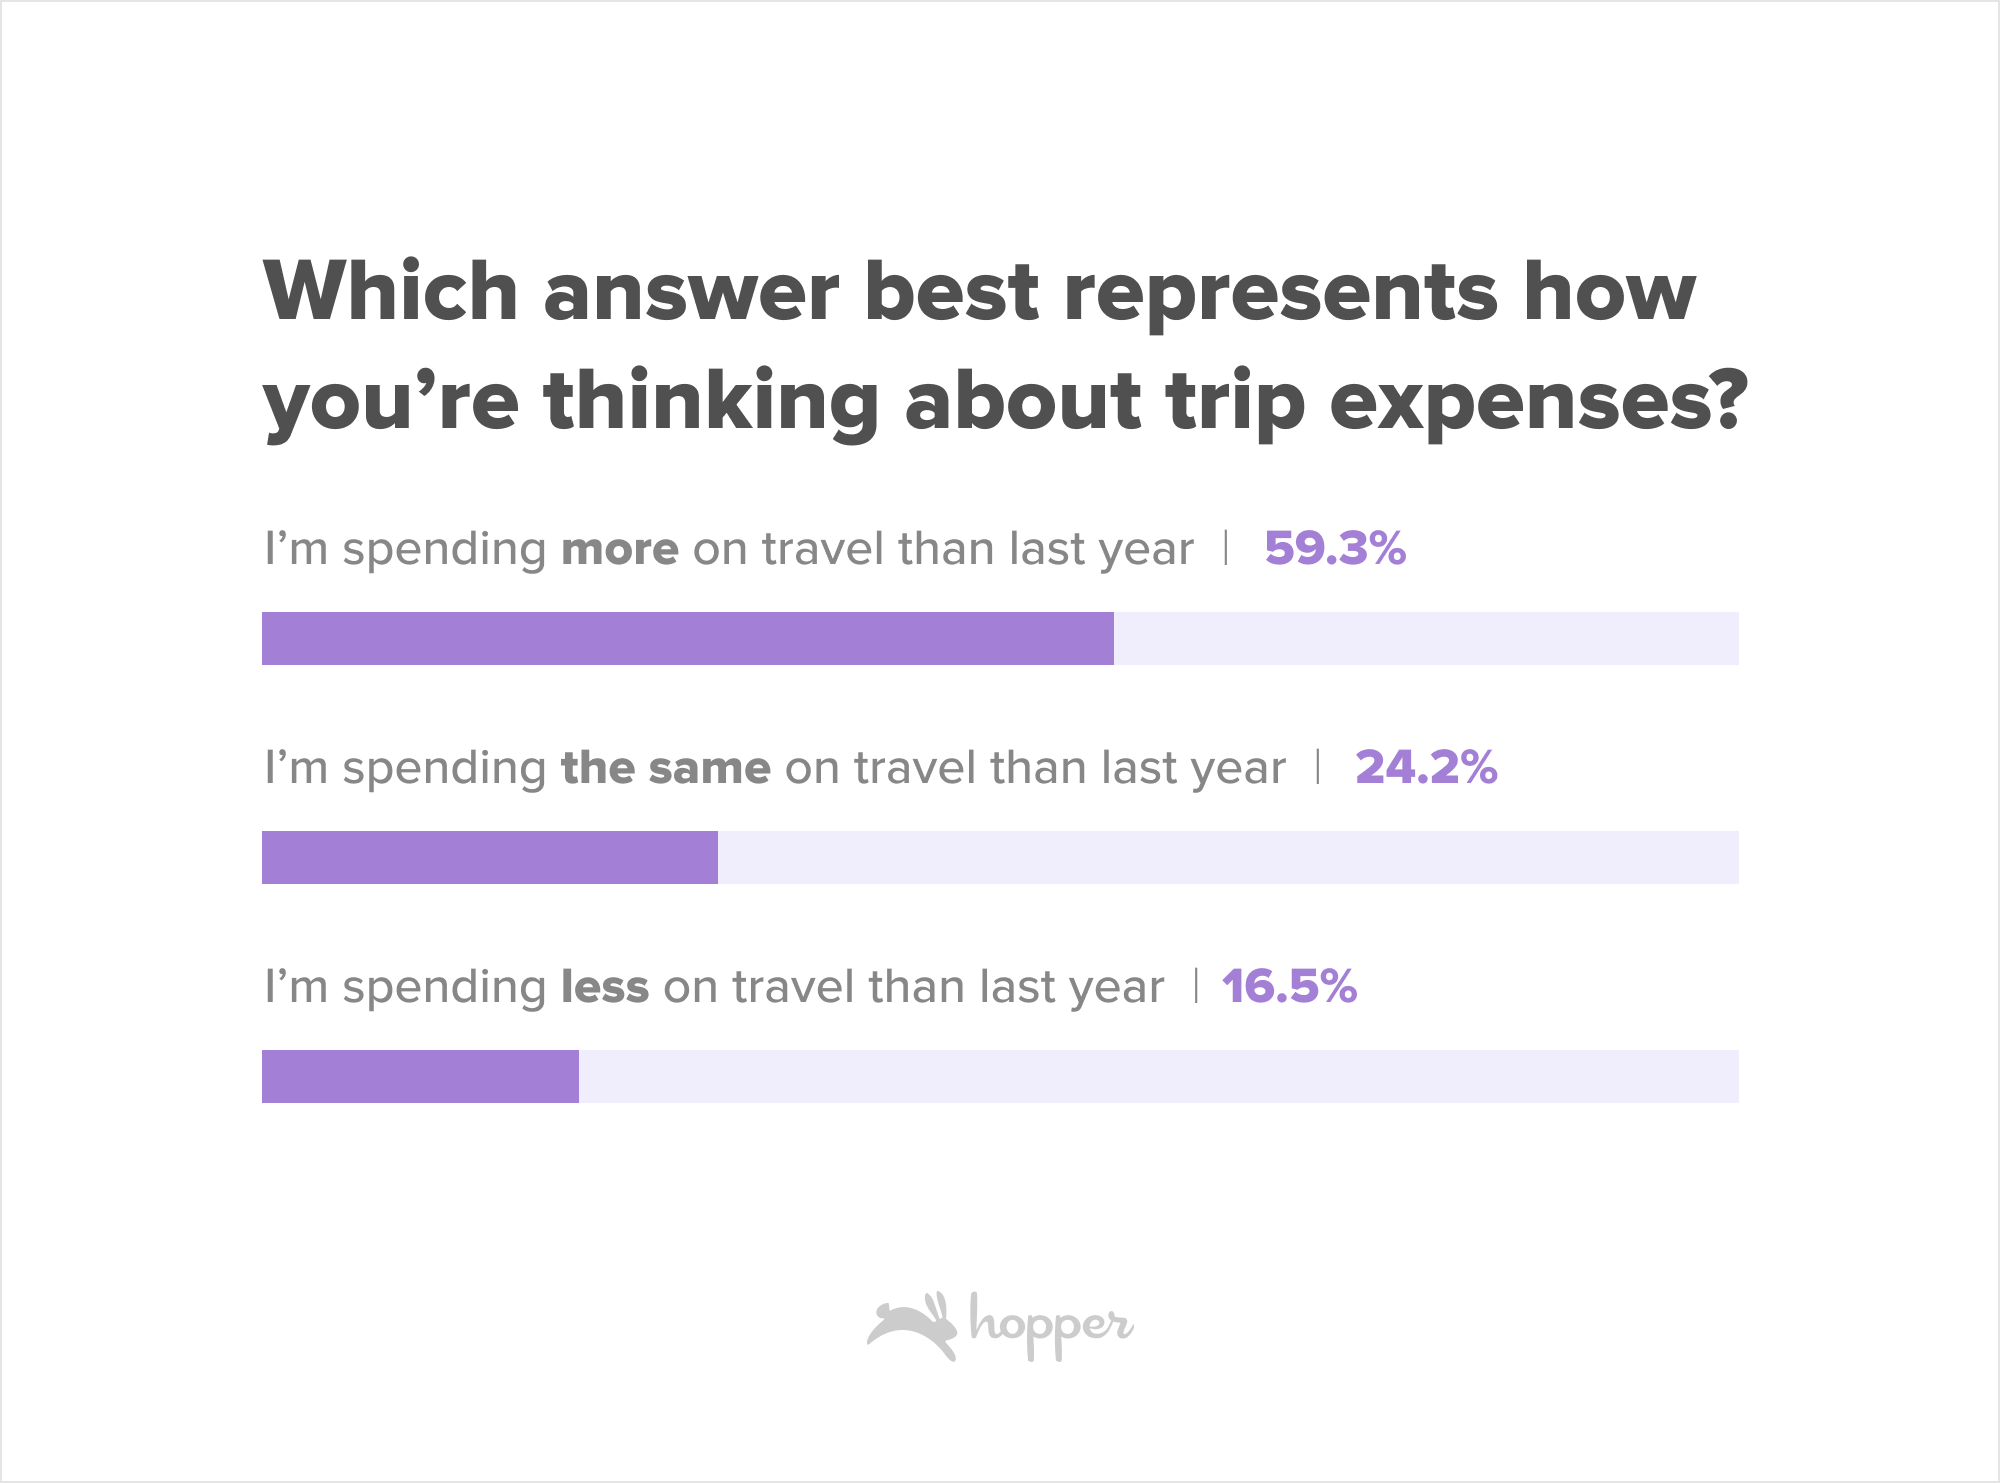
With inflation and high interest rates driving up costs for families across the country, wallets and travel budgets are under more pressure this year than ever before. Despite this, more than half of Hopper users claim they plan to take more trips this year than in previous years and 84% plan to spend more on travel than in previous years. Finding the lowest price for a trip is critical to these travelers and their ability to get more travel out of their budget. Travelers are spending more to add ancillaries, flexibility and protection to their trips. On average, Hopper flight bookers are spending $30 extra on their trip for products like Hopper's Change and Cancel for Any Reason plans, Flight Disruption Guarantee, Price Freeze, and more.
Millennials and Gen Z are willing to pay the premium for top amenities for their stay.
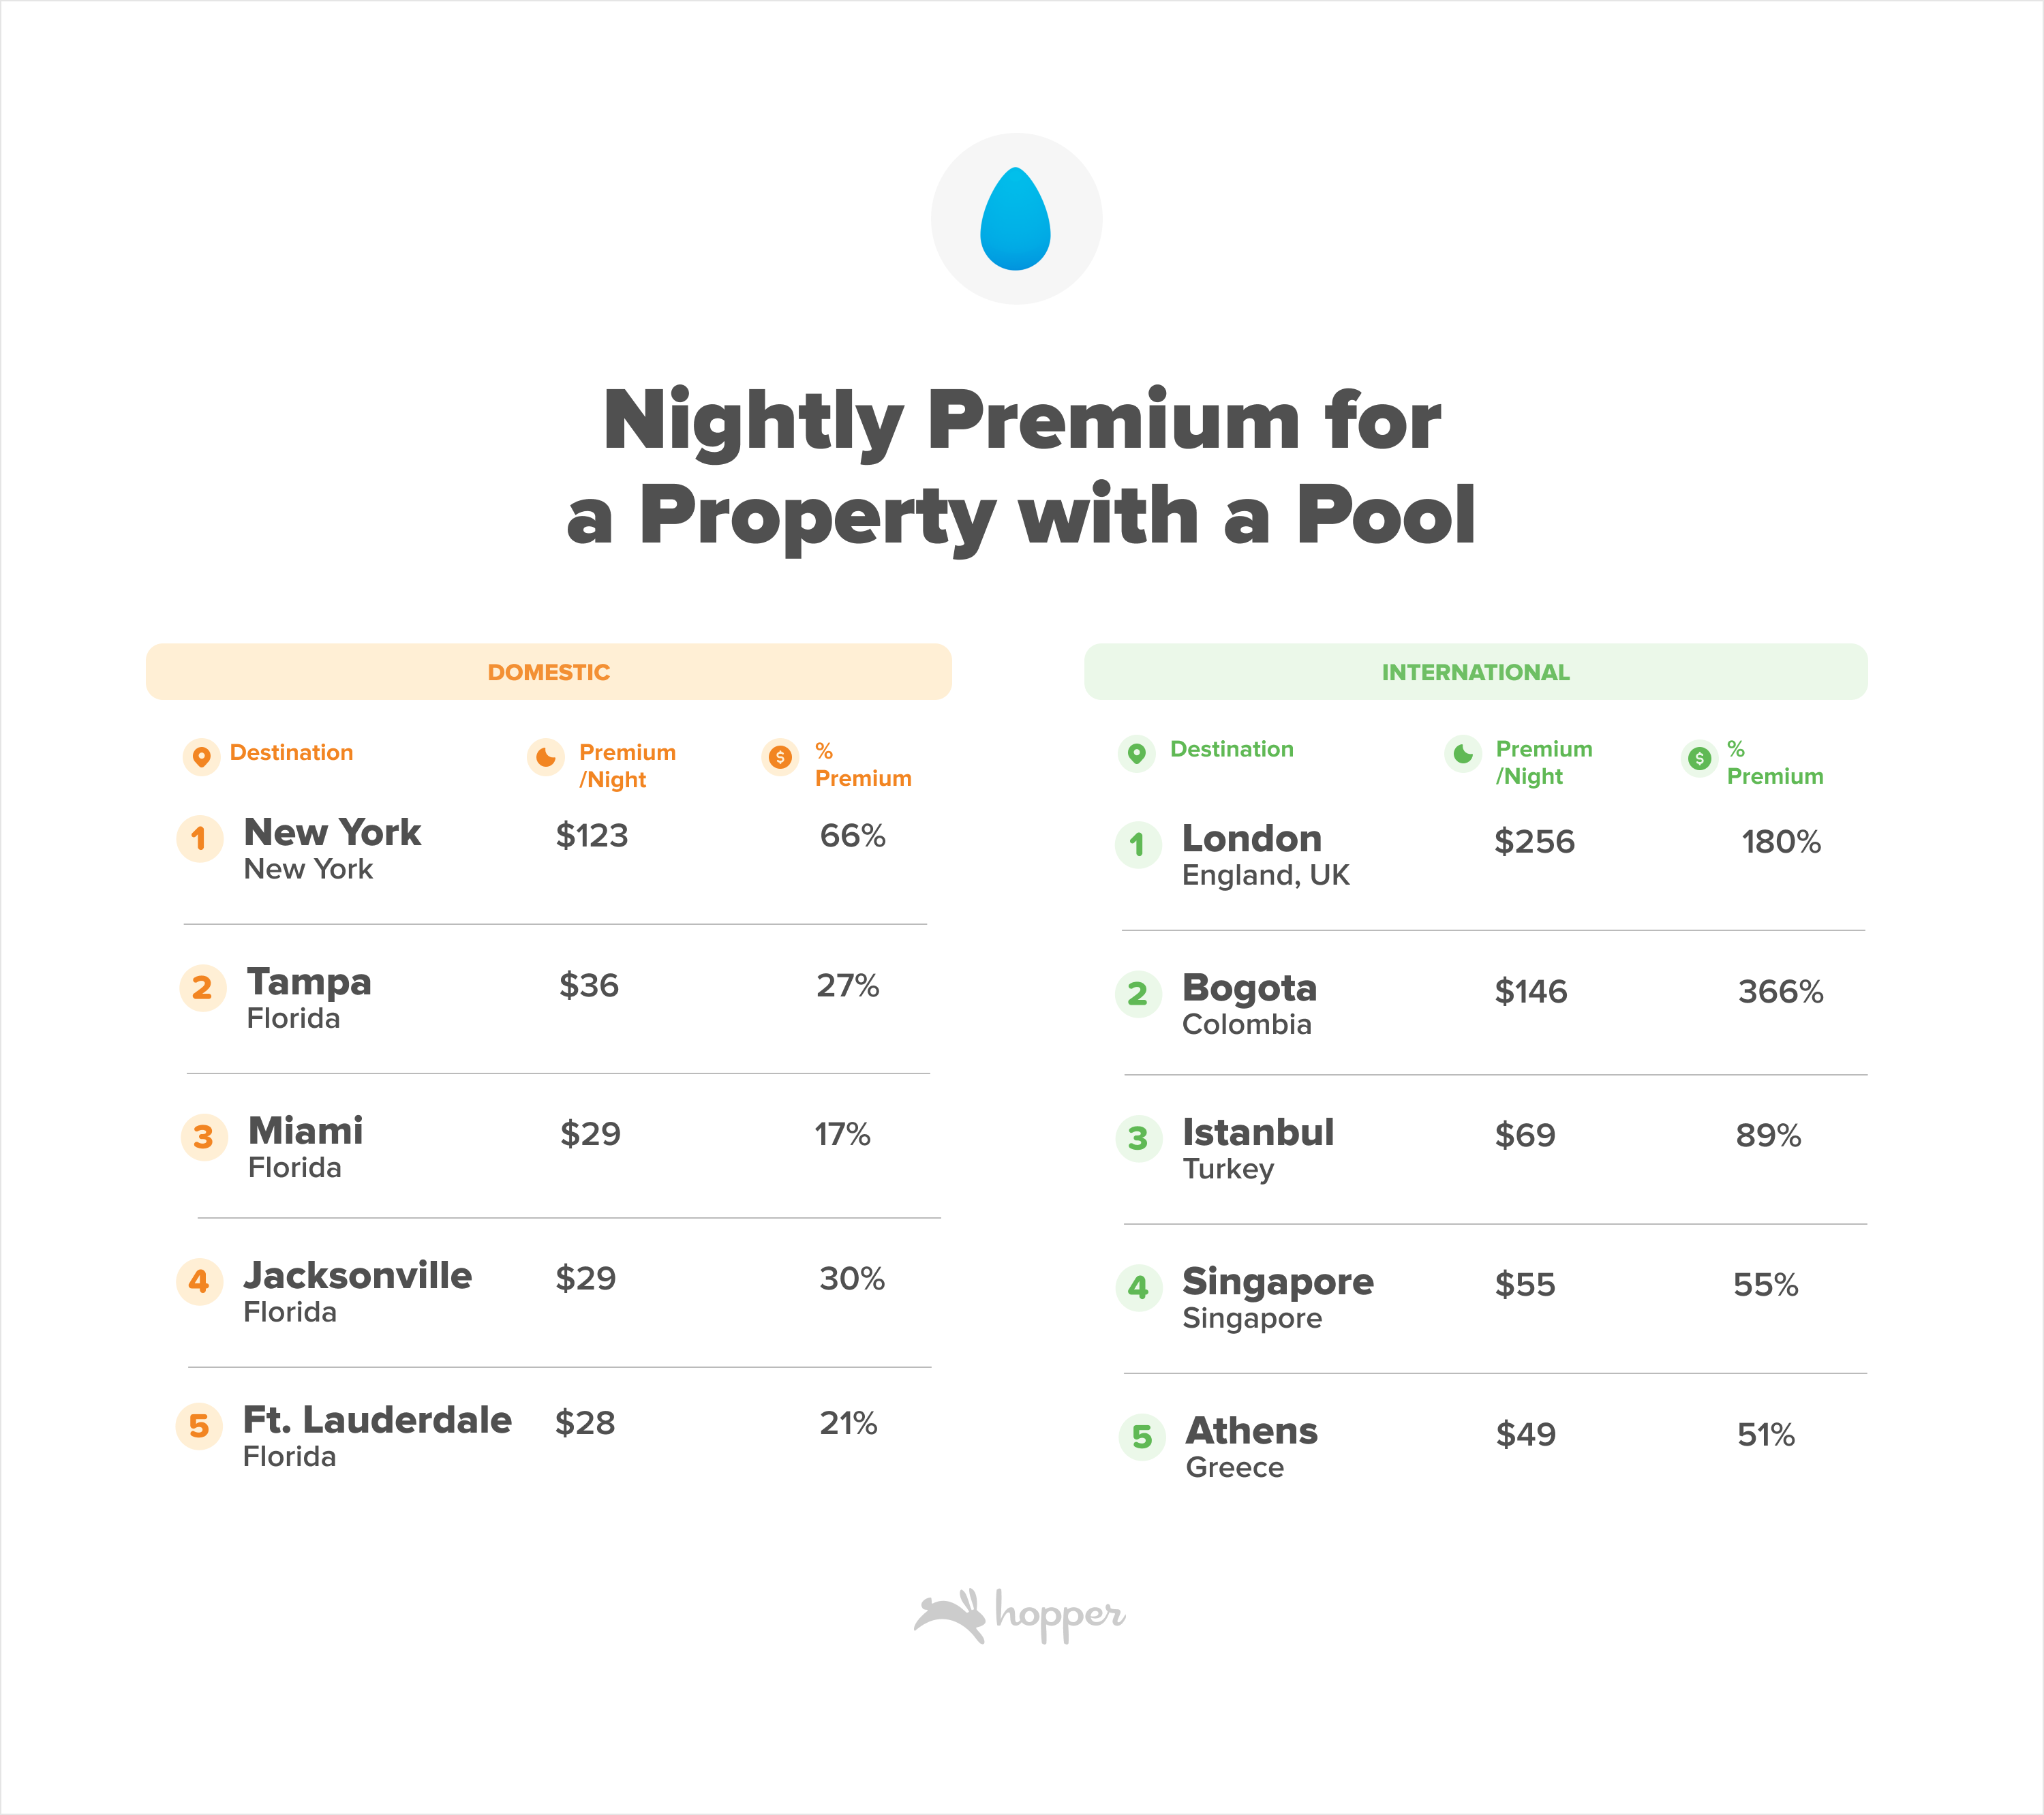
Hopper bookers are willing to pay a premium for certain amenities during their stay, with access to pools and pet friendly options standing out as some of the most important when it comes to booking.
In 2022 around 34% of Hopper hotel bookings were for stays where customers had access to indoor or outdoor pools. For trips in the US, travelers paid premiums in major markets as high as $123 per night in New York City for access to a pool. In Florida, where warm weather attracts visitors from around the world, bookers paid an average of $30 more per night for pool access. International travelers showed the same willingness to splurge on hotels with pools, paying as much as a $256 premium in London and $146 premium in Bogota.
Travelers were also willing to shell out more for the convenience of including their four legged friends in trips last year, with 60% of Hopper hotel bookings in 2022 for pet friendly properties. In the US the premium peaked in San Francisco, with bookers paying $59 more per night to bring their furry friends. Across major cities in the US the pet friendly premium ranged from 30% more per night to 51% more per night.
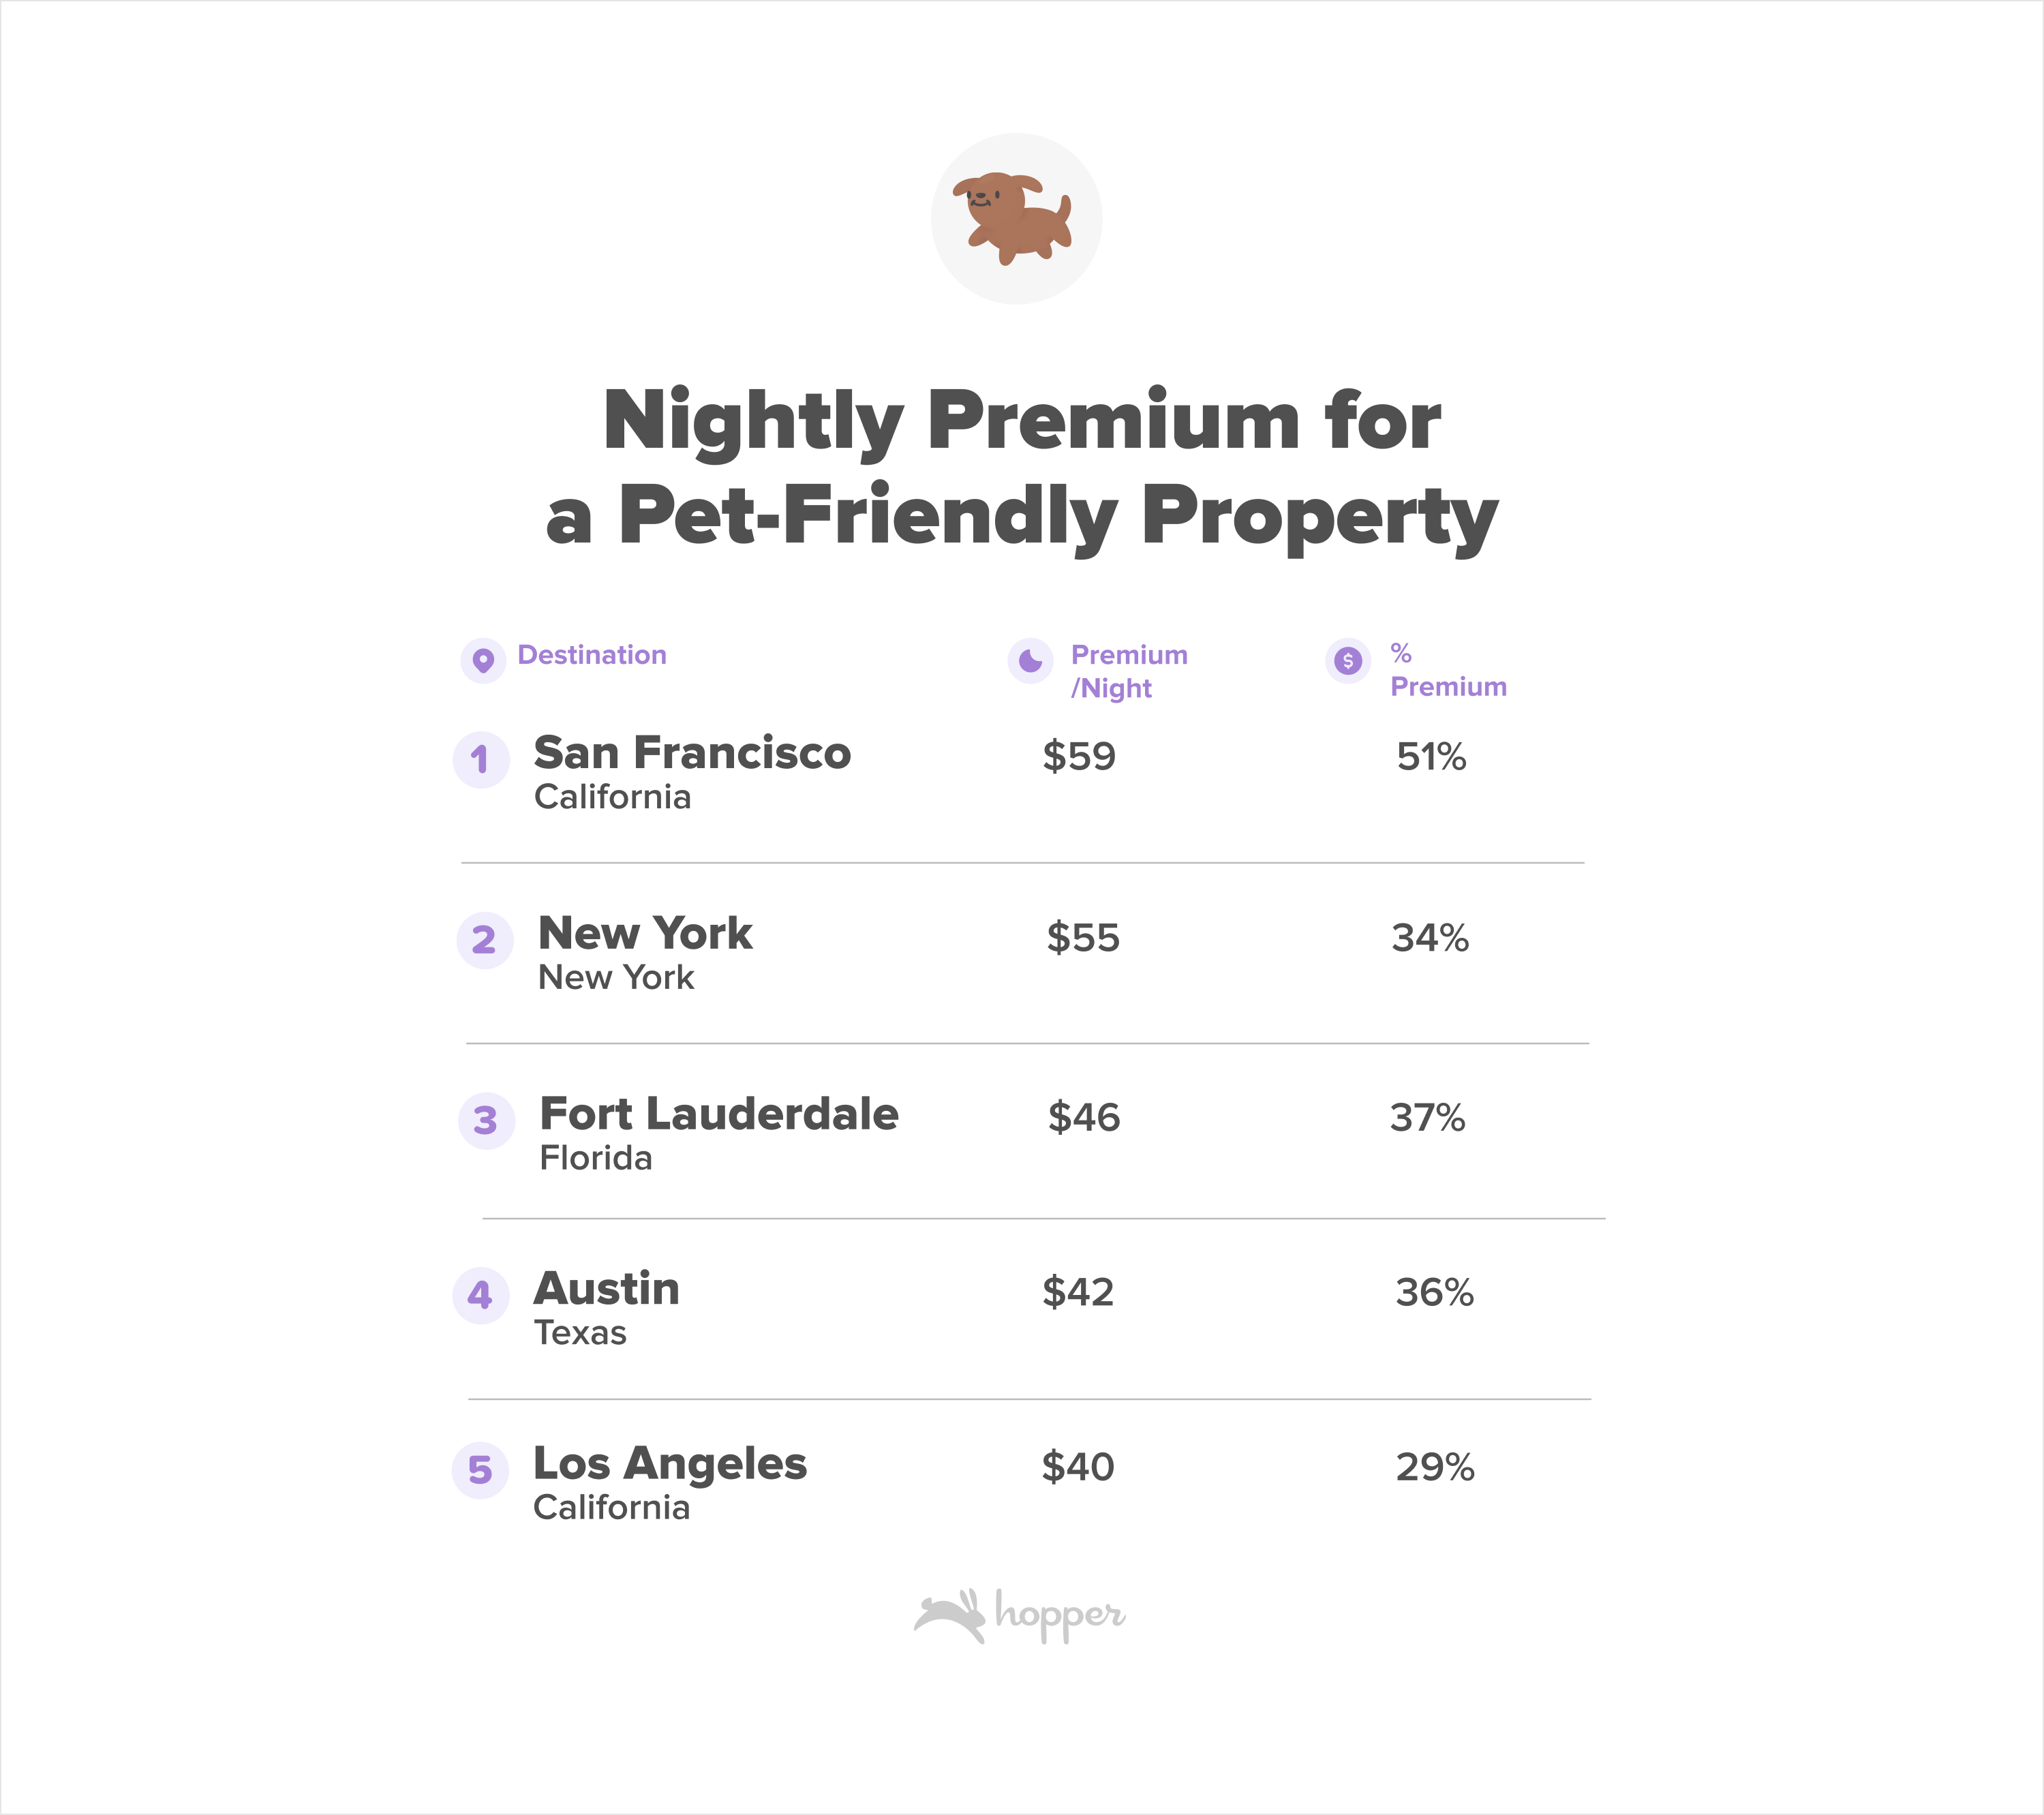
Even as wallets are stretched further by inflation, high interest rates and economic concerns this year, Millennials and GenZ are splurging on amenities most important to them during their stays.
Social media continues to play a role in travel planning.
Millennials came of age with social media, while GenZ has never lived without it. It’s unsurprising, then, that social media is taking an increasing role in the travel planning process. Just under half of Hopper users plan to use social media during the trip planning process for everything from finding destination inspiration to finding exclusive deals and discount codes. Facebook and Instagram remain the most popular platforms for travel planning, followed by TikTok and Snapchat.
How are Millennials & Gen Z travelers changing their purchasing behavior?
1. Staying price sensitive & using price monitoring
Even as travelers expect to travel more and spend more, flight and hotel bookers remain incredibly price conscious. Though travelers started the planning process later in 2022, they returned to the app to check the price of their trip 25% - 50% morethan in previous years. Travelers last year checked the price of their domestic trip an average of 16 times before booking, a 33% increase compared to 2019. Trips planned to further flung destinations in Europe, Asia, Africa and the Mideast were price checked 50% more often than in 2019. Hopper users also book the cheapest flight available more than 50% of the time, choosing low prices over potentially higher priced cabin classes or more popular flight times of the day.
2. Blending work and travel to save on travel costs and PTO.
45% of Hopper’s users who are in the workforce or students have some level of remote work flexibility, and more than half say it has changed how they think about and plan travel.
⅓ of remote flexible users are using this flexibility to travel more during the work and school week when prices are at their lowest for airfare and hotels. Others are traveling for longer or taking more trips, without having to use up precious vacation days to travel.
3. Getting more out of work sponsored trips.
Whether it’s adding a few extra days onto a trip to make a weekend out of it, or swapping your return flight for one onto a new destination, Millennials and Gen Z travelers are taking advantage of work sponsored travel to sneak in more personal travel. About ⅓ of Hopper users have traveled or expect to travel for work in the next year and a whopping 77% of those users plan to tack personal travel onto the trip.
4. Using Hopper’s Price Freeze to lock in incredible deals.
It’s not uncommon for travelers to see an amazing deal on a trip they’re planning to book, only to miss out on the deal because they need to have PTO approved, check with work and school schedules or even wait until payday to make the purchase. Hopper users are increasingly leveraging Price Freeze on flights and hotels to lock in low prices for longer. Today, 1 in 5 customers will freeze the price of a hotel before they book!
With Hopper’s Price Freeze tool you can lock in the current price of a flight or hotel when you see a good deal. For a small upfront fee, Price Freeze allows you to hold the price for a short window so you can book it at a more convenient time. If the price of the flight or hotel increases, Hopper will cover the price difference up to a set amount. If the price decreases, you’ll pay the lower price.
5. Adding flexibility and protection to their trips.
As travelers focus on getting more bang for their buck, customers are looking for more flexibility and to protect their travel experience. Today, nearly one in three Hopper bookers are adding flexibility or protection to their trip, 10% more customers than at this time last year!
Hopper offers a range of plans to help travelers book with extra flexibility and peace of mind. Hopper offers both Cancel and Change For Any Reason plans which allow you to modify your travel plans without any additional charge. With Hopper’s Cancel For Any Reason, you can cancel your flight for any reason up to 24 hours prior to your scheduled departure and receive at least 80% of your ticket cost back. With Hopper’s Change For Any Reason, you can change your flight, including date, time, and airline, for any reason up to 24 hours prior to your scheduled departure with no added fees.
For travelers looking for additional flexibility once they’ve arrived at their destination, Hopper offers a Leave For Any Reason Policy. Have you ever arrived at your destination only to be disappointed by the hotel property or your room? With Hopper’s Leave for Any Reason, if you arrive at the hotel and you’re unhappy with your accommodations at the time of check-in, you can rebook yourself at a different hotel with the same star rating for free.
6. Protection against the unexpected
Followed by recent flight disruptions making news headlines, travel anxiety is high. In fact, in a recent survey conducted by Hopper, 76% of travelers expressed concerns about disruptions on their upcoming trips. So much so that 1 in 5 travelers booking flights on the Hopper app are adding Flight Disruption Guarantee to their travel plans to protect against potential delays or cancellations. By adding Flight Disruption Guarantee to your trip, if you're delayed, canceled or miss a connection, you can instantly rebook yourself on the next flight, regardless of carrier, directly on the Hopper app for no extra charge.
Methodology
The survey results included are from in-app surveys sent to Hopper users via an app notification. More than 1,500 responses were used to compile the survey statistics used in this report.
The data utilized in this report comes from Hopper app bookings, Hopper app searches and Hopper's real-time feed of "shadow traffic" containing the results of consumer airfare searches made on GDSs worldwide. Hopper collects, from several Global Distribution System partners, 25 to 30 billion airfare price quotes every day from searches happening all across the web.
Data about flight schedules, delays, cancellations and airline capacity comes from the Official Aviation Guide (OAG) reporting on actual flight performance departing from U.S airports.
MIDT data was used in this report to compare the general population of online travel bookers to Hopper’s younger demographic. MIDT data is an aggregate of all bookings made via any online travel agency (OTA) through the GDS.
Get the Hopper app to find the best deals.
You could save up to 40% on your next flight!
