Consumer Airfare Index - February 2019: Airfare Starting to Rise for First Time This Year
Flight prices will jump in February and are going to continue to rise through early spring.

Patrick Surry - Thu Jan 01 1970

Summary
This month, we project a 6.4% increase in domestic round-trip flight prices to $218 in February.
Flight prices are down 5.2% compared to the same time two years ago.
We’re forecasting that prices will start rising to around $229 by April, continuing to around $251 by June.
Jet fuel prices fell 14% in February to $1.72/gal.
US domestic capacity will experience a 6.1% YoY growth in February.
Airfare Starting to Rise for First Time This Year
Despite the fact that the price of jet fuel fell about 14% last month, we're forecasting that fight prices are going to jump to $218 round-trip in February and then continue to rise through early spring. We're predicting prices will rise to $229 round-trip by April and then peak at $251 round-trip in June. Compared to the same time last year, however, prices will be down 2.4% and down 5.2% compared to two years ago.
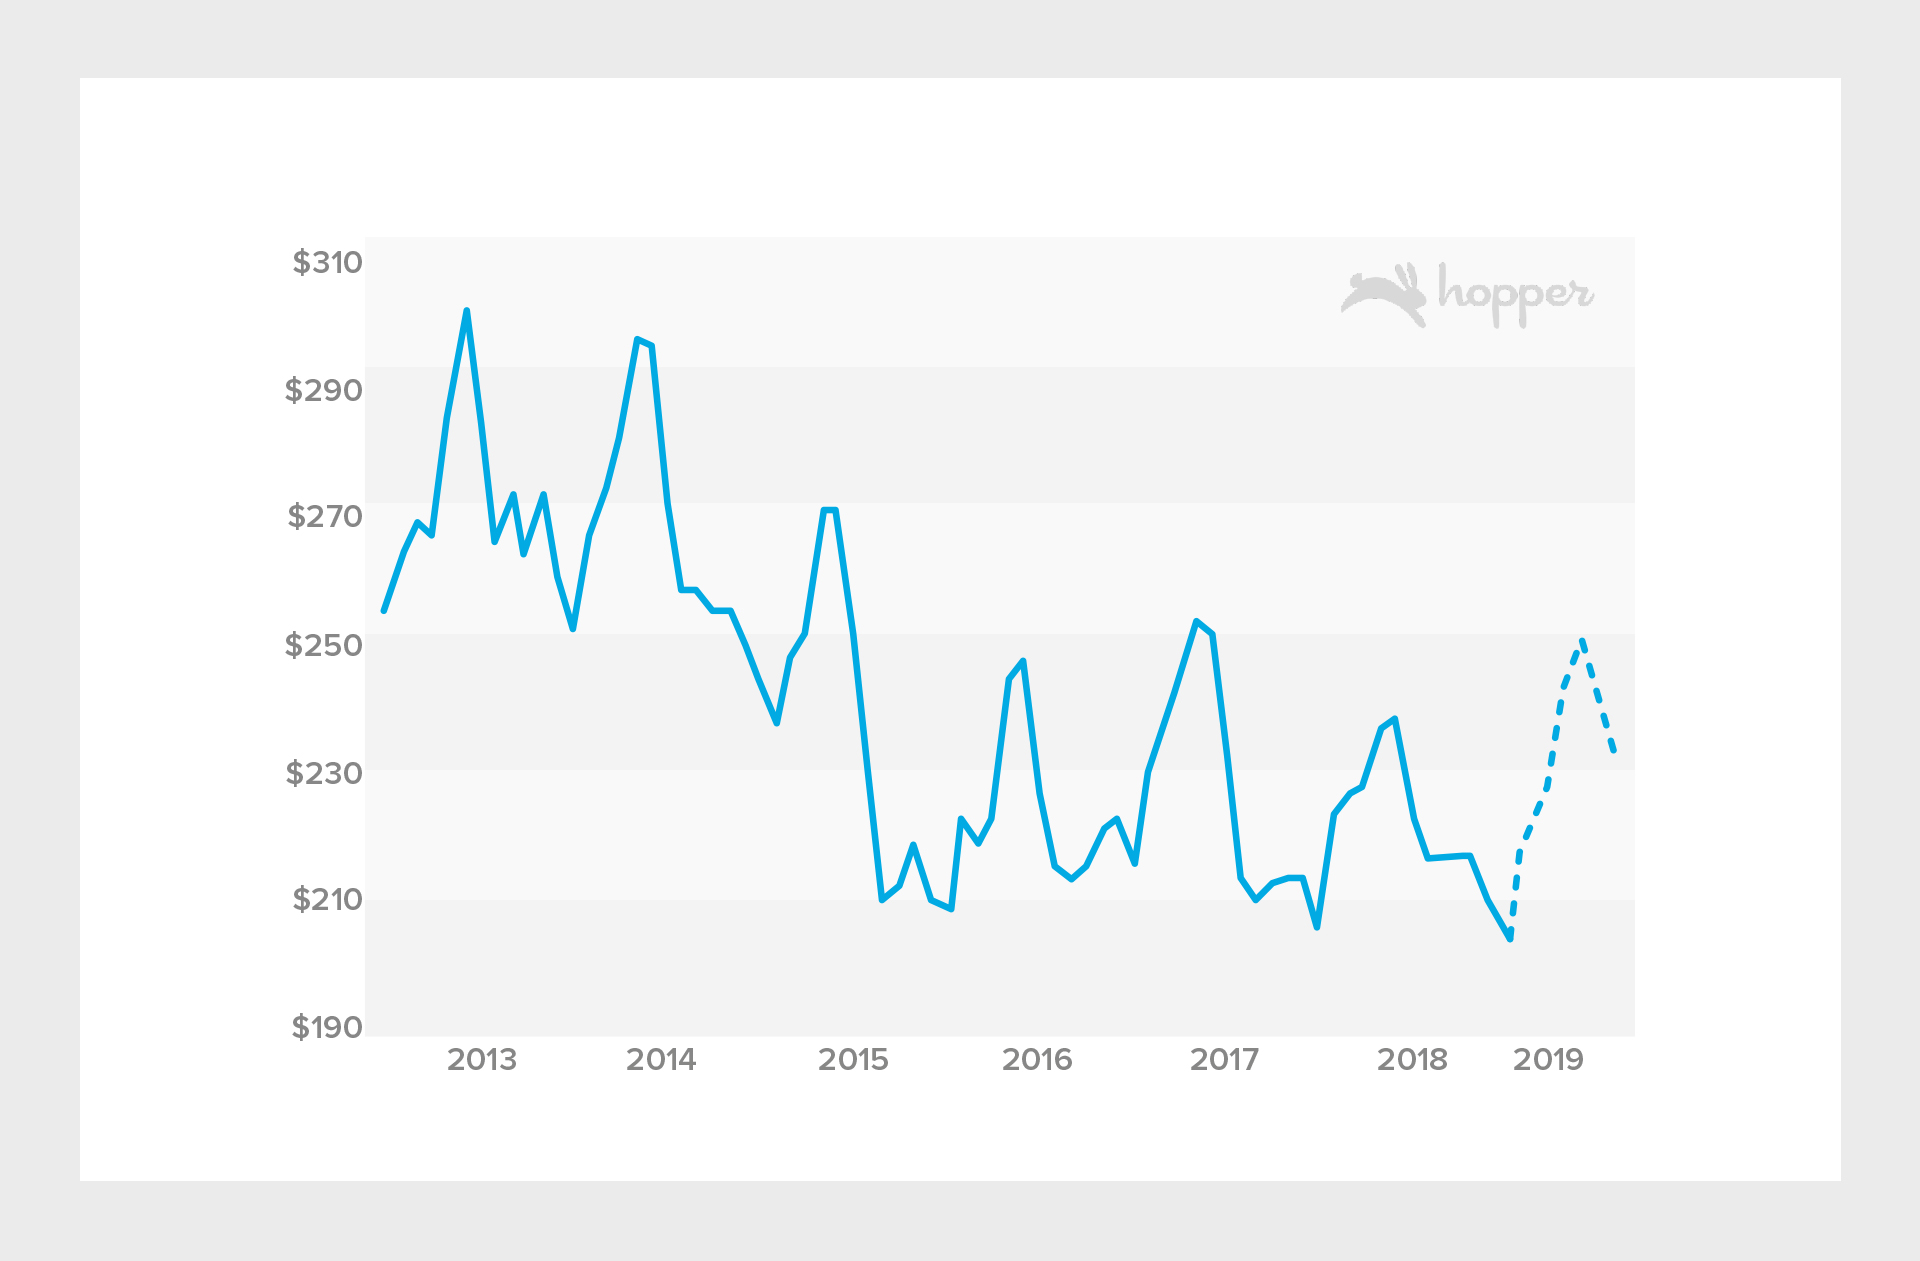
<center> Figure 1: Actual average domestic consumer airfare prices through January 2019 (solid line), with six-month forward forecast price levels (dashed), showing prices rising through June.</center>
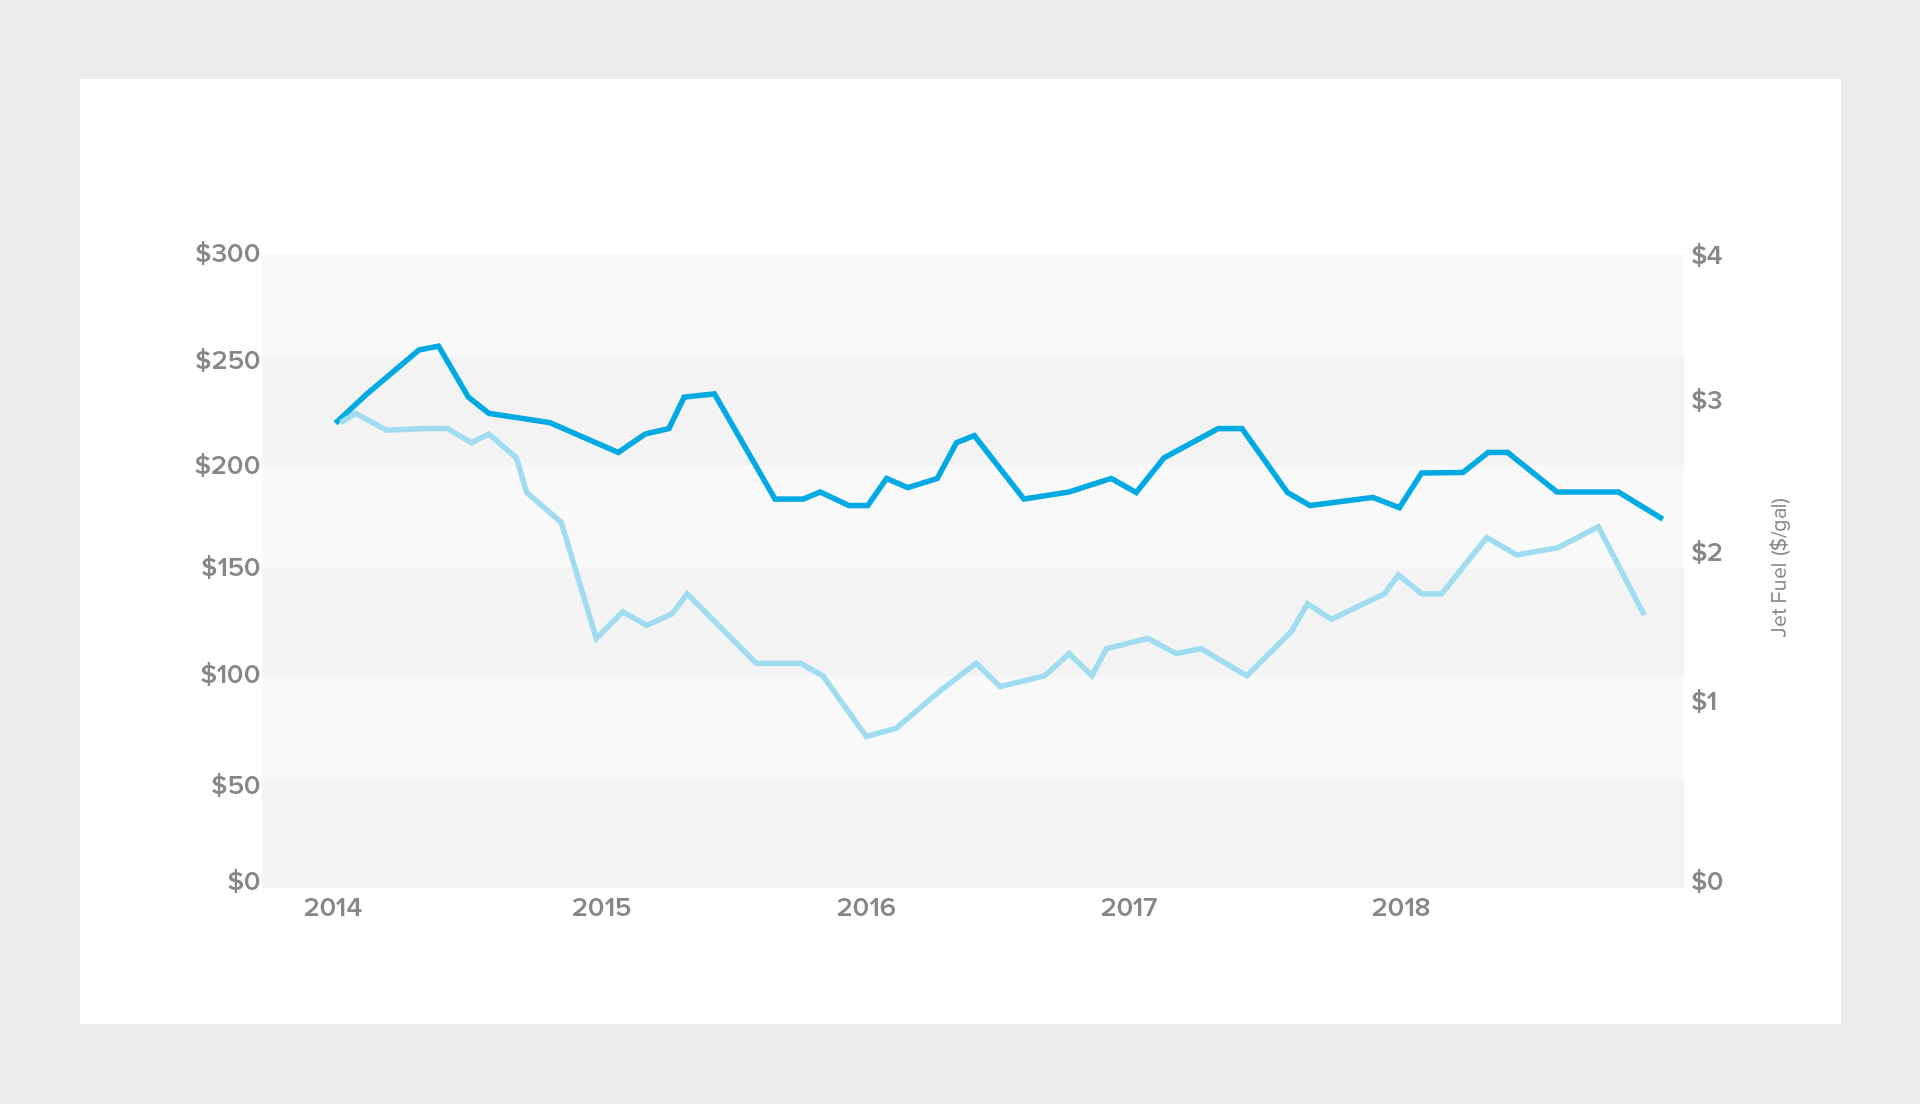
<center> Figure 2: Jet fuel prices fell 14% in February to $1.72/gal</center>
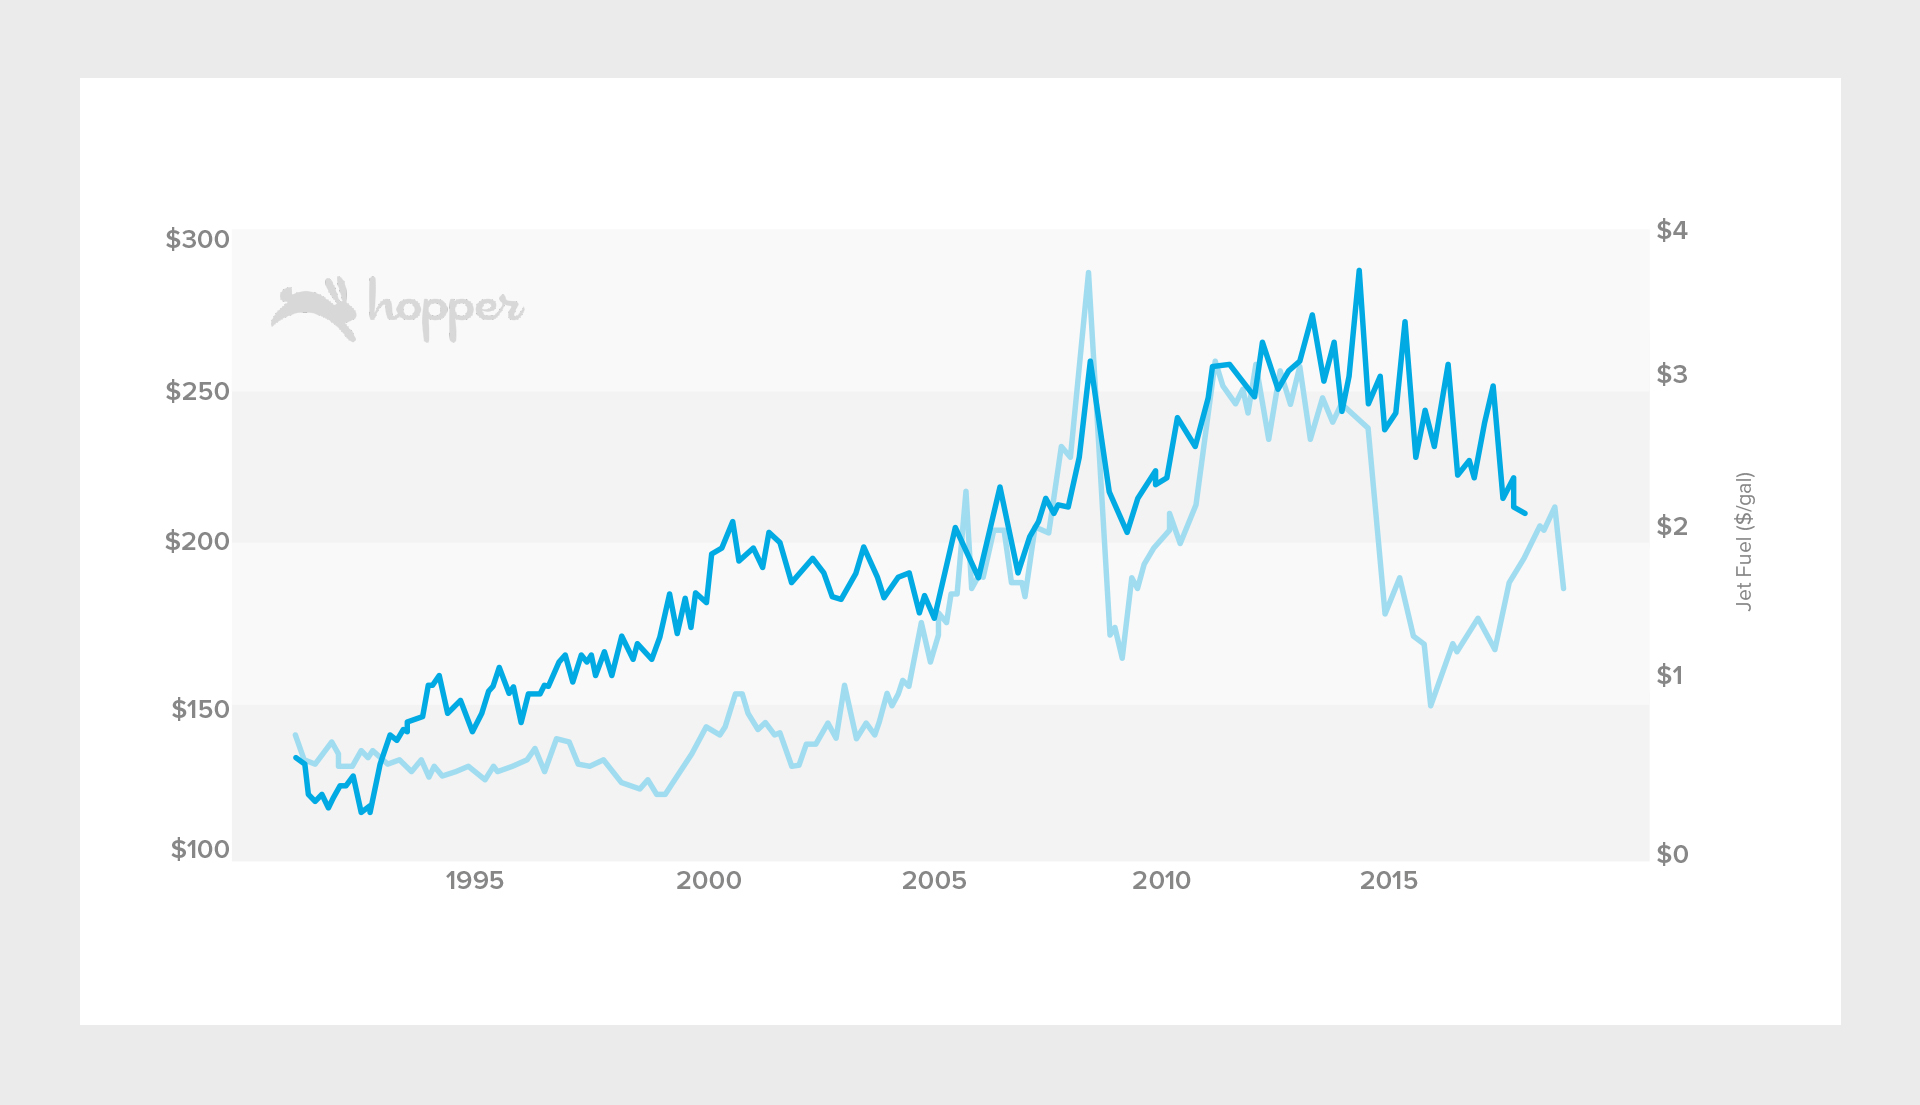
<center> Figure 3: A longer range view shows that jet fuel prices are now around 2011 levels, growing again since a significant drop in 2015. Airfare has been on a controlled downward trend for the past 3 years and is reflecting 2009-2010 price levels.</center>
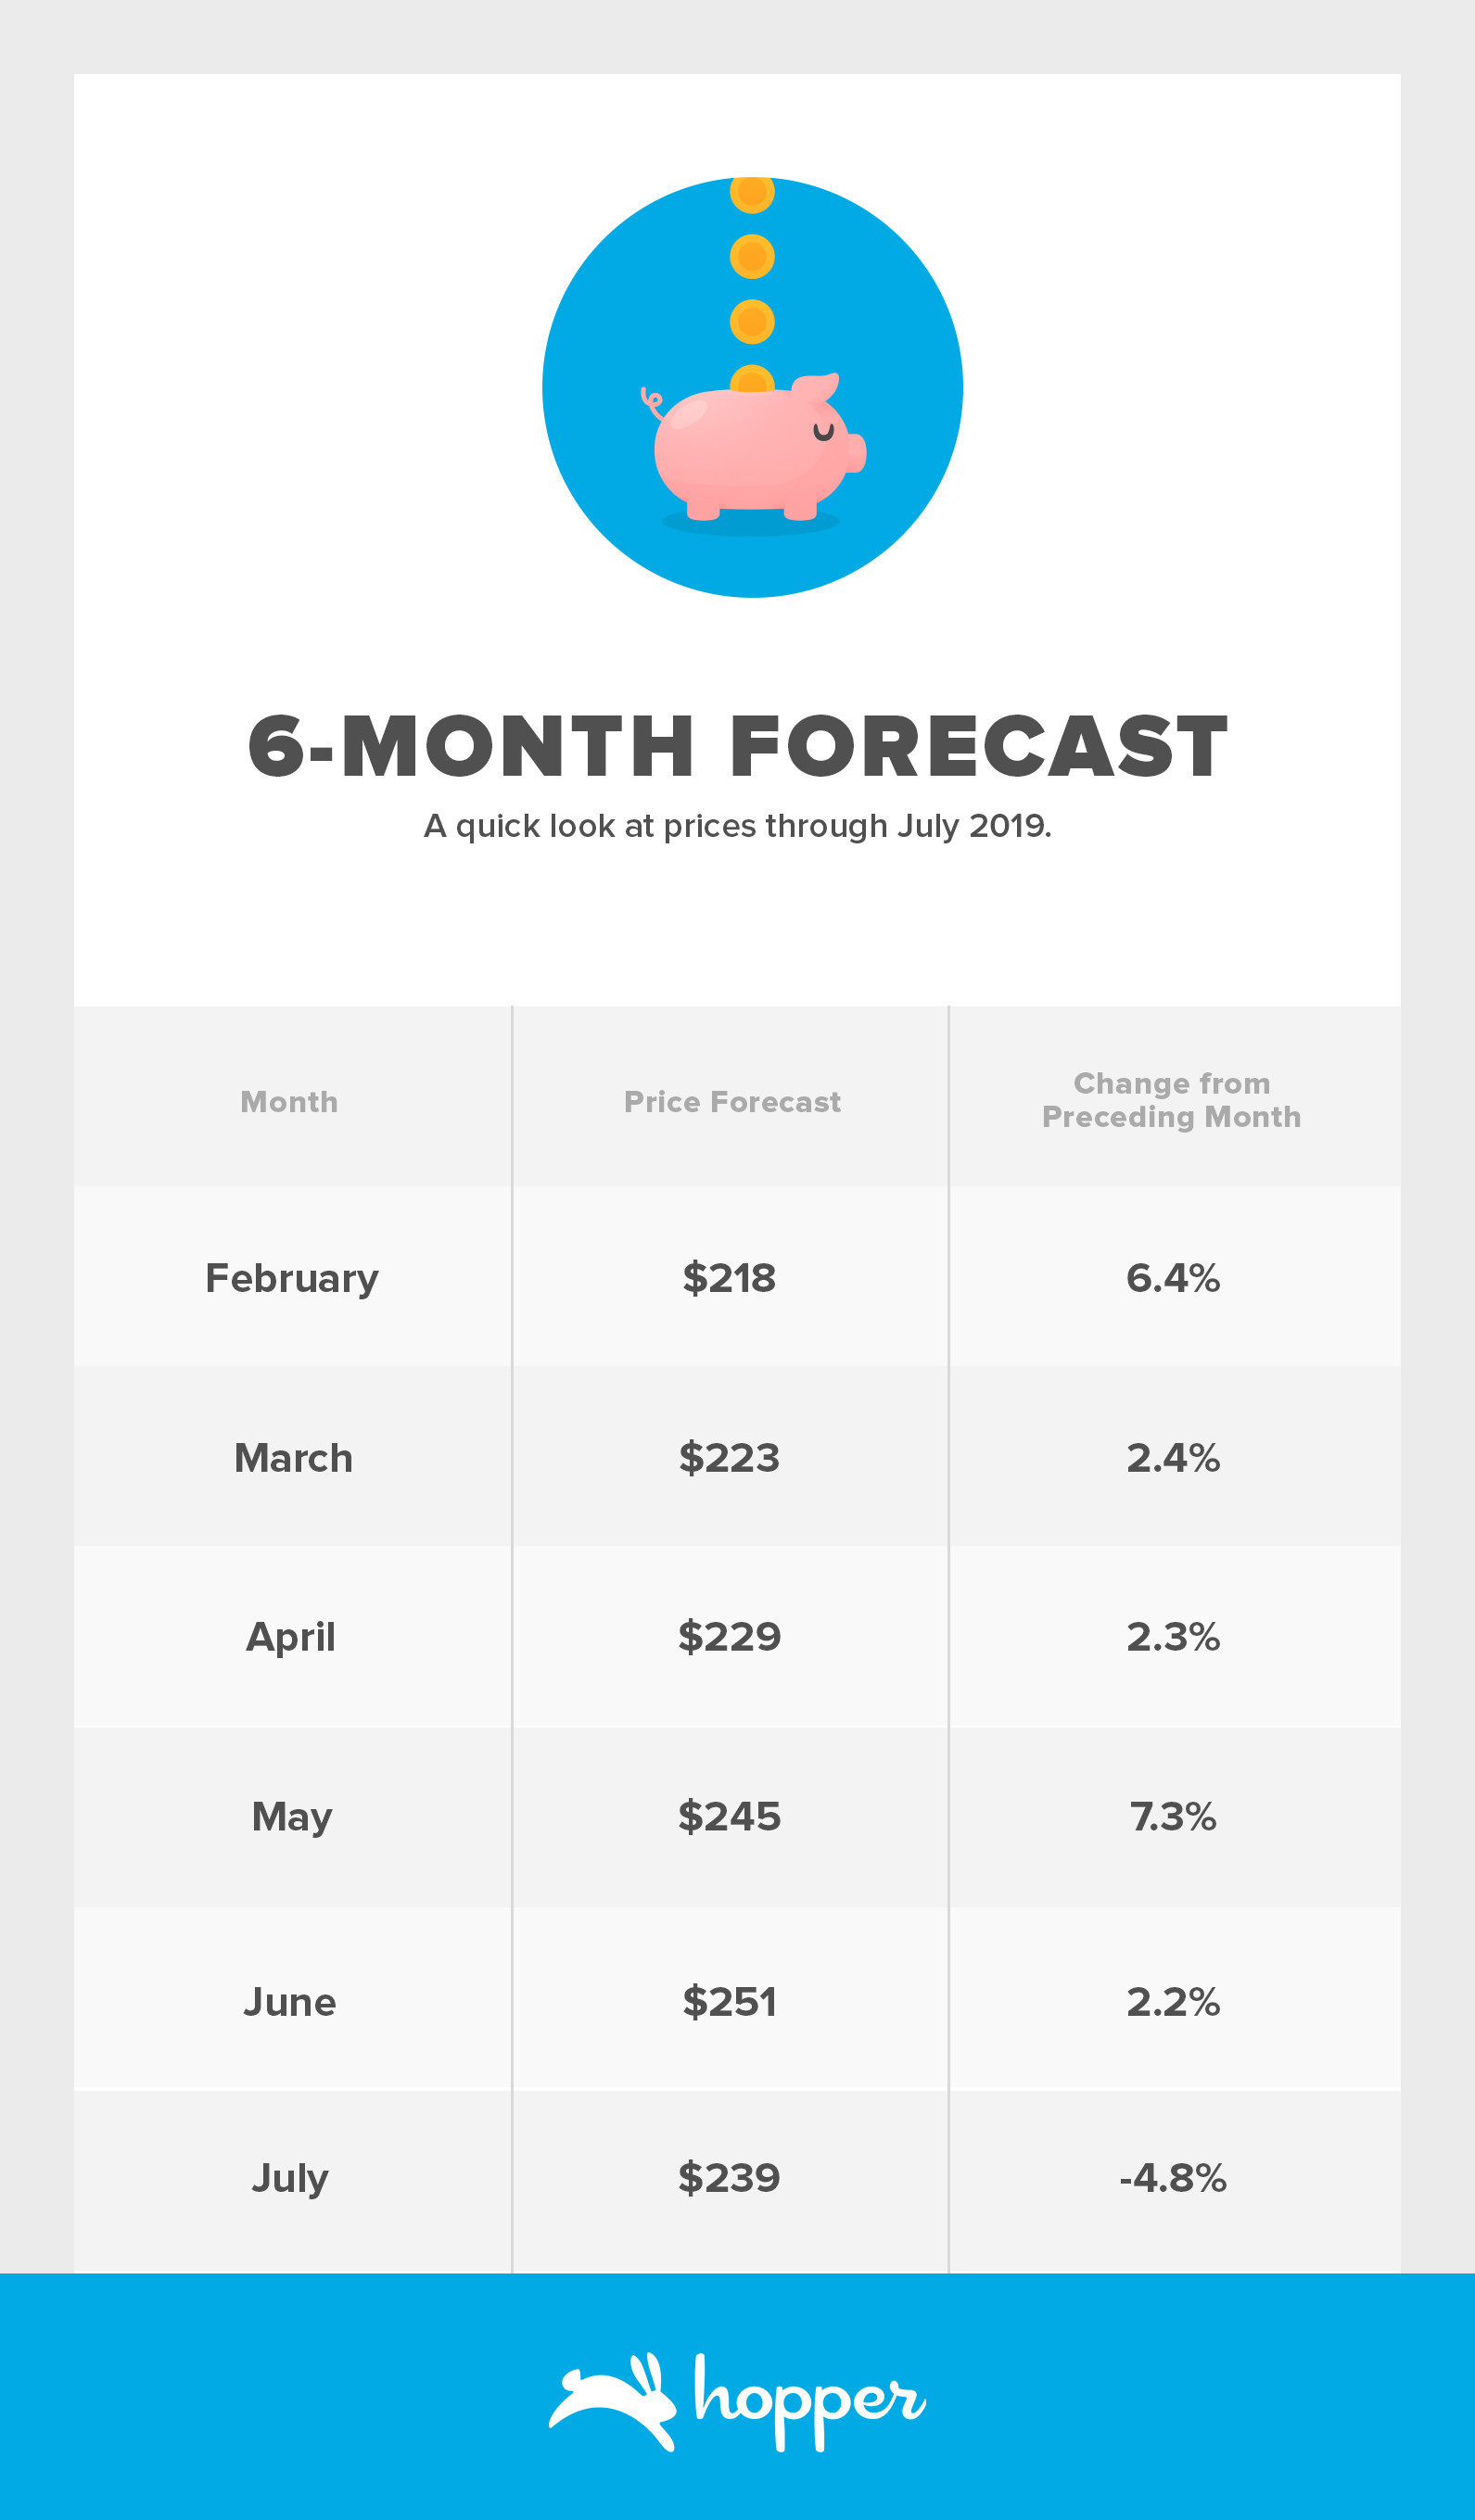
<center> Table 1: Hopper’s six-month forecast for consumer airfare, showing prices rising until June.</center>
Destinations to Watch on Hopper in February
The Hopper app predicts future flight prices with 95% accuracy. If you select the “Watch This Trip” button, Hopper will constantly monitor prices and notify you the instant you should buy.
We calculated popular destinations for upcoming travel where you could save most by watching prices on Hopper. If you’re interested in visiting any of these destinations in the next few months, we recommend setting your watch on Hopper now so that you can be alerted about price drops this month.
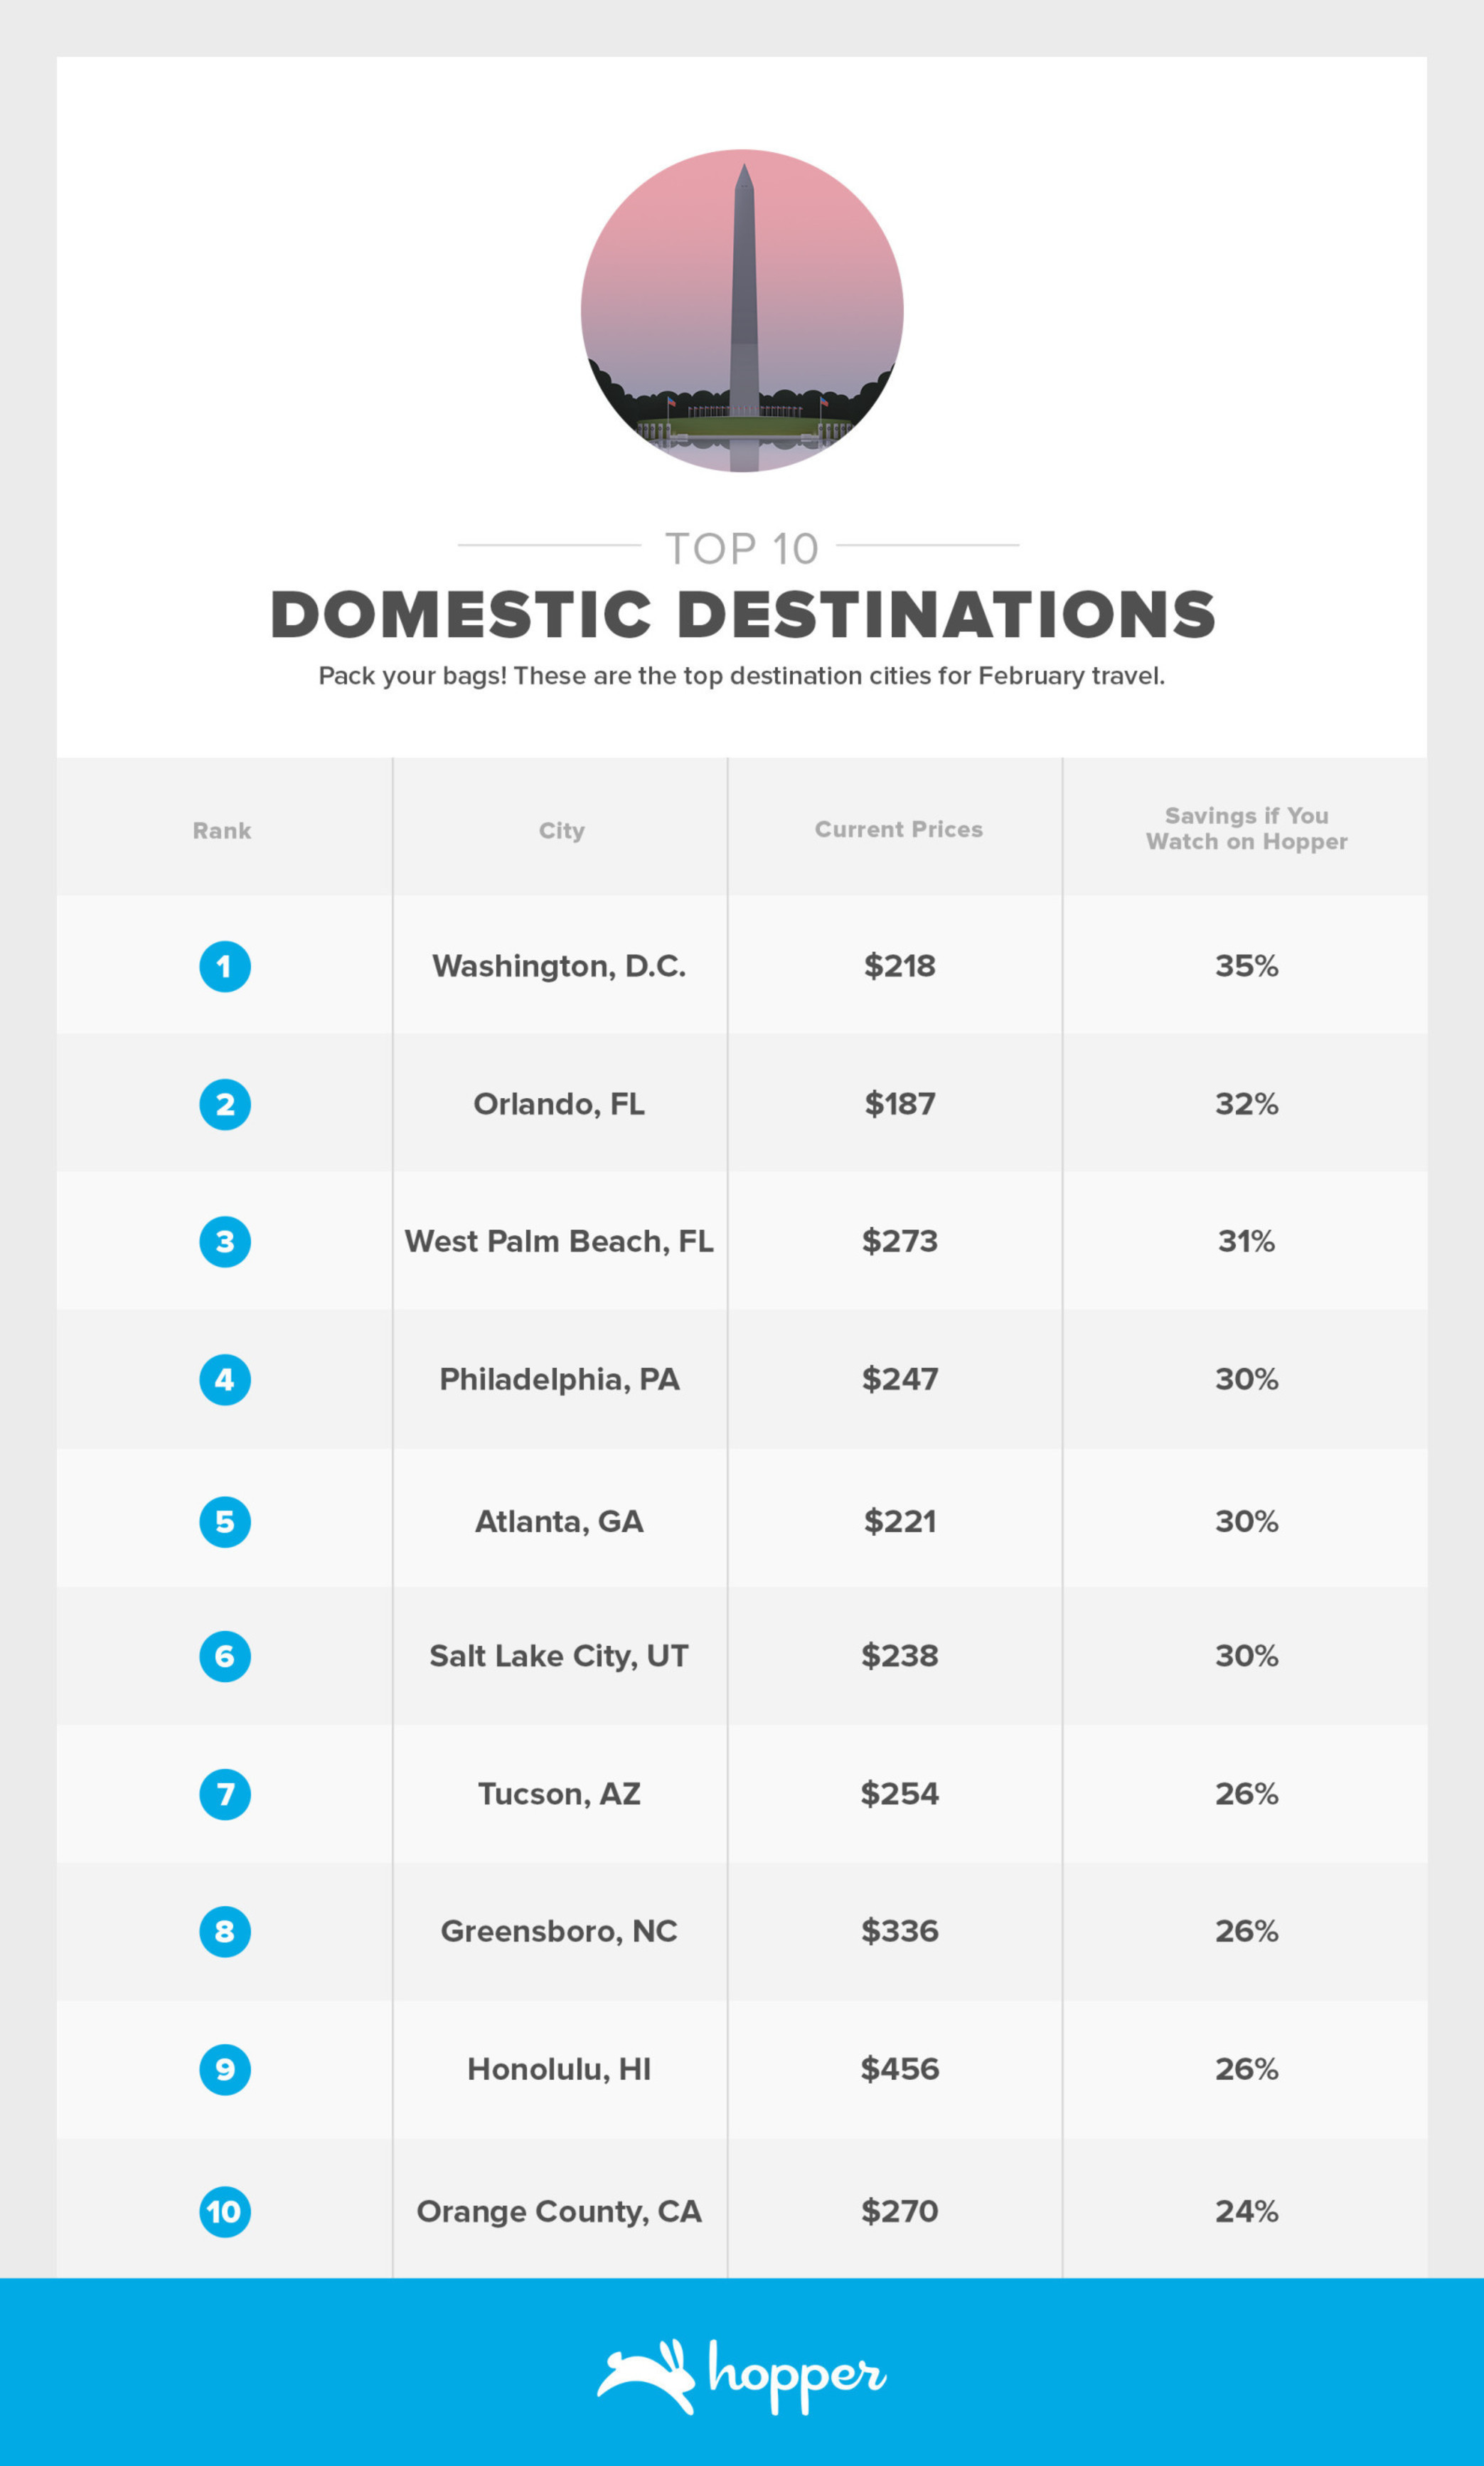
<center> Table 2: Domestic destinations most likely to drop in price on Hopper in February.</center>
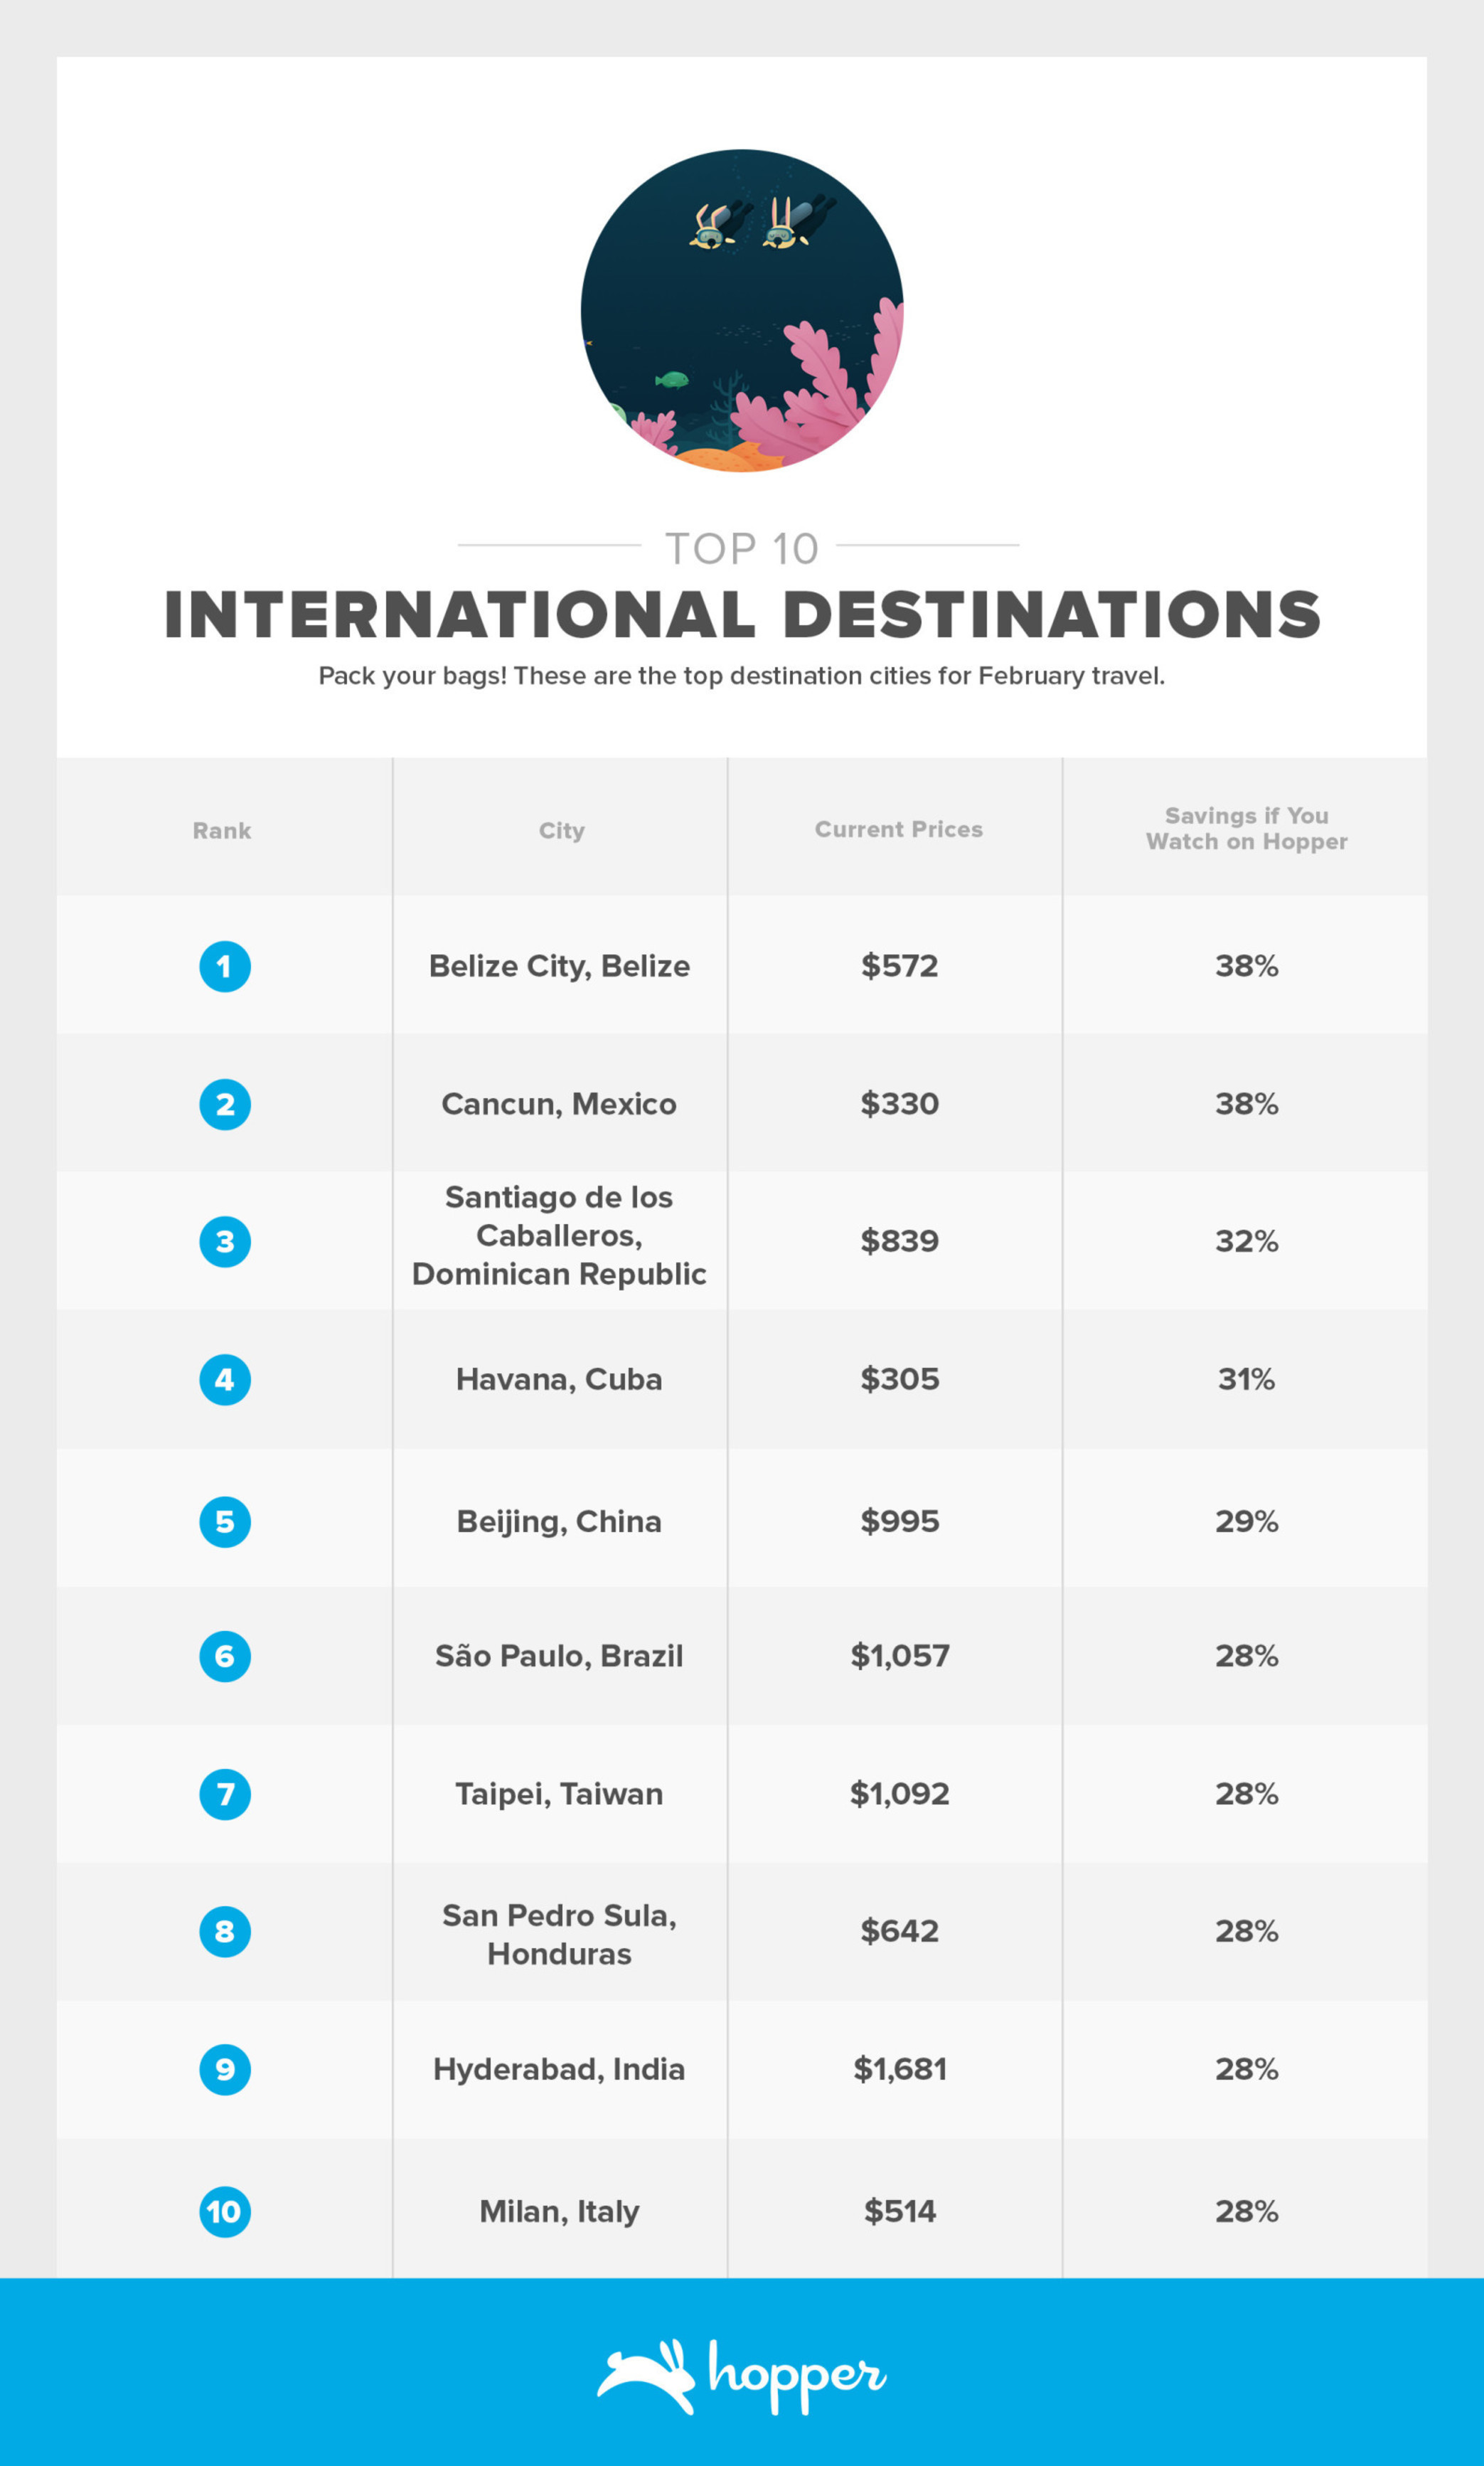
<center> Table 3: International destinations most likely to drop in price on Hopper in February.</center>
Capacity Trends
The capacity of major US carriers changed 5.5% and 1.2% from February of last year for domestic and international routes respectively. Foreign major carrier capacity grew 2.2% on U.S. international routes. Low-cost carrier capacity over the past year has drastically expanded. US low-cost carriers exhibited a YoY capacity growth of 13.1% and 48.7% in domestic and international markets respectively. Foreign low-cost carriers grew 7.9% from February of last year.
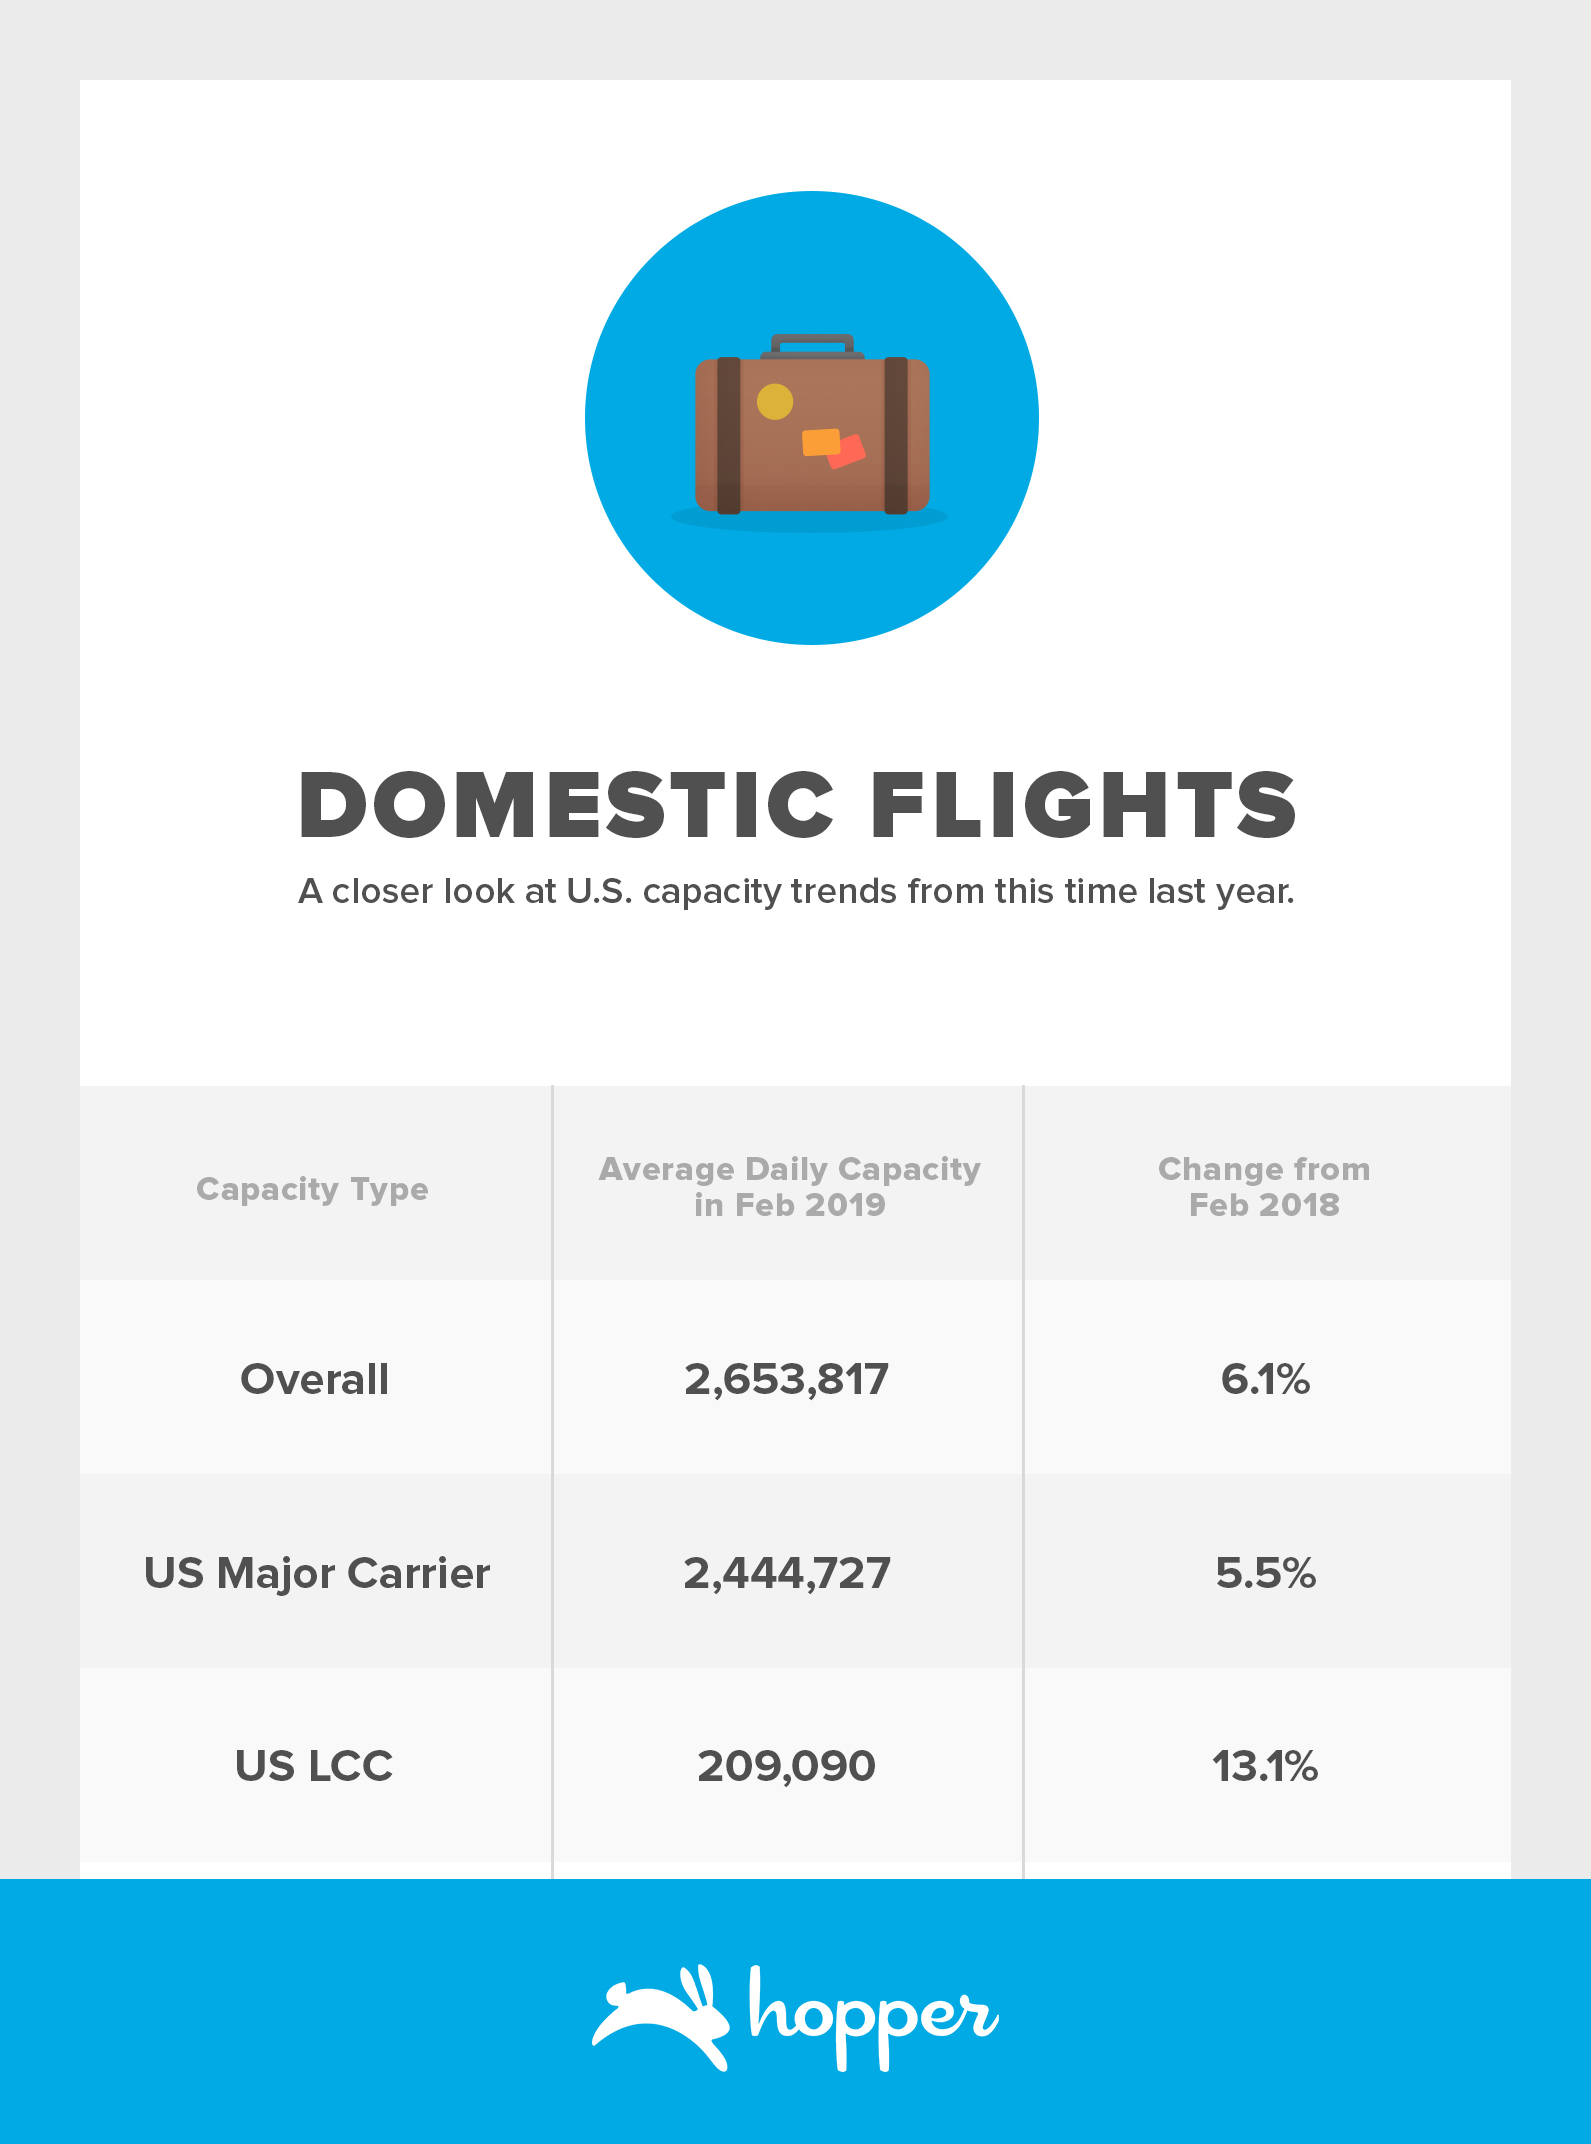
<center> Table 4: Domestic Capacity Trends</center>
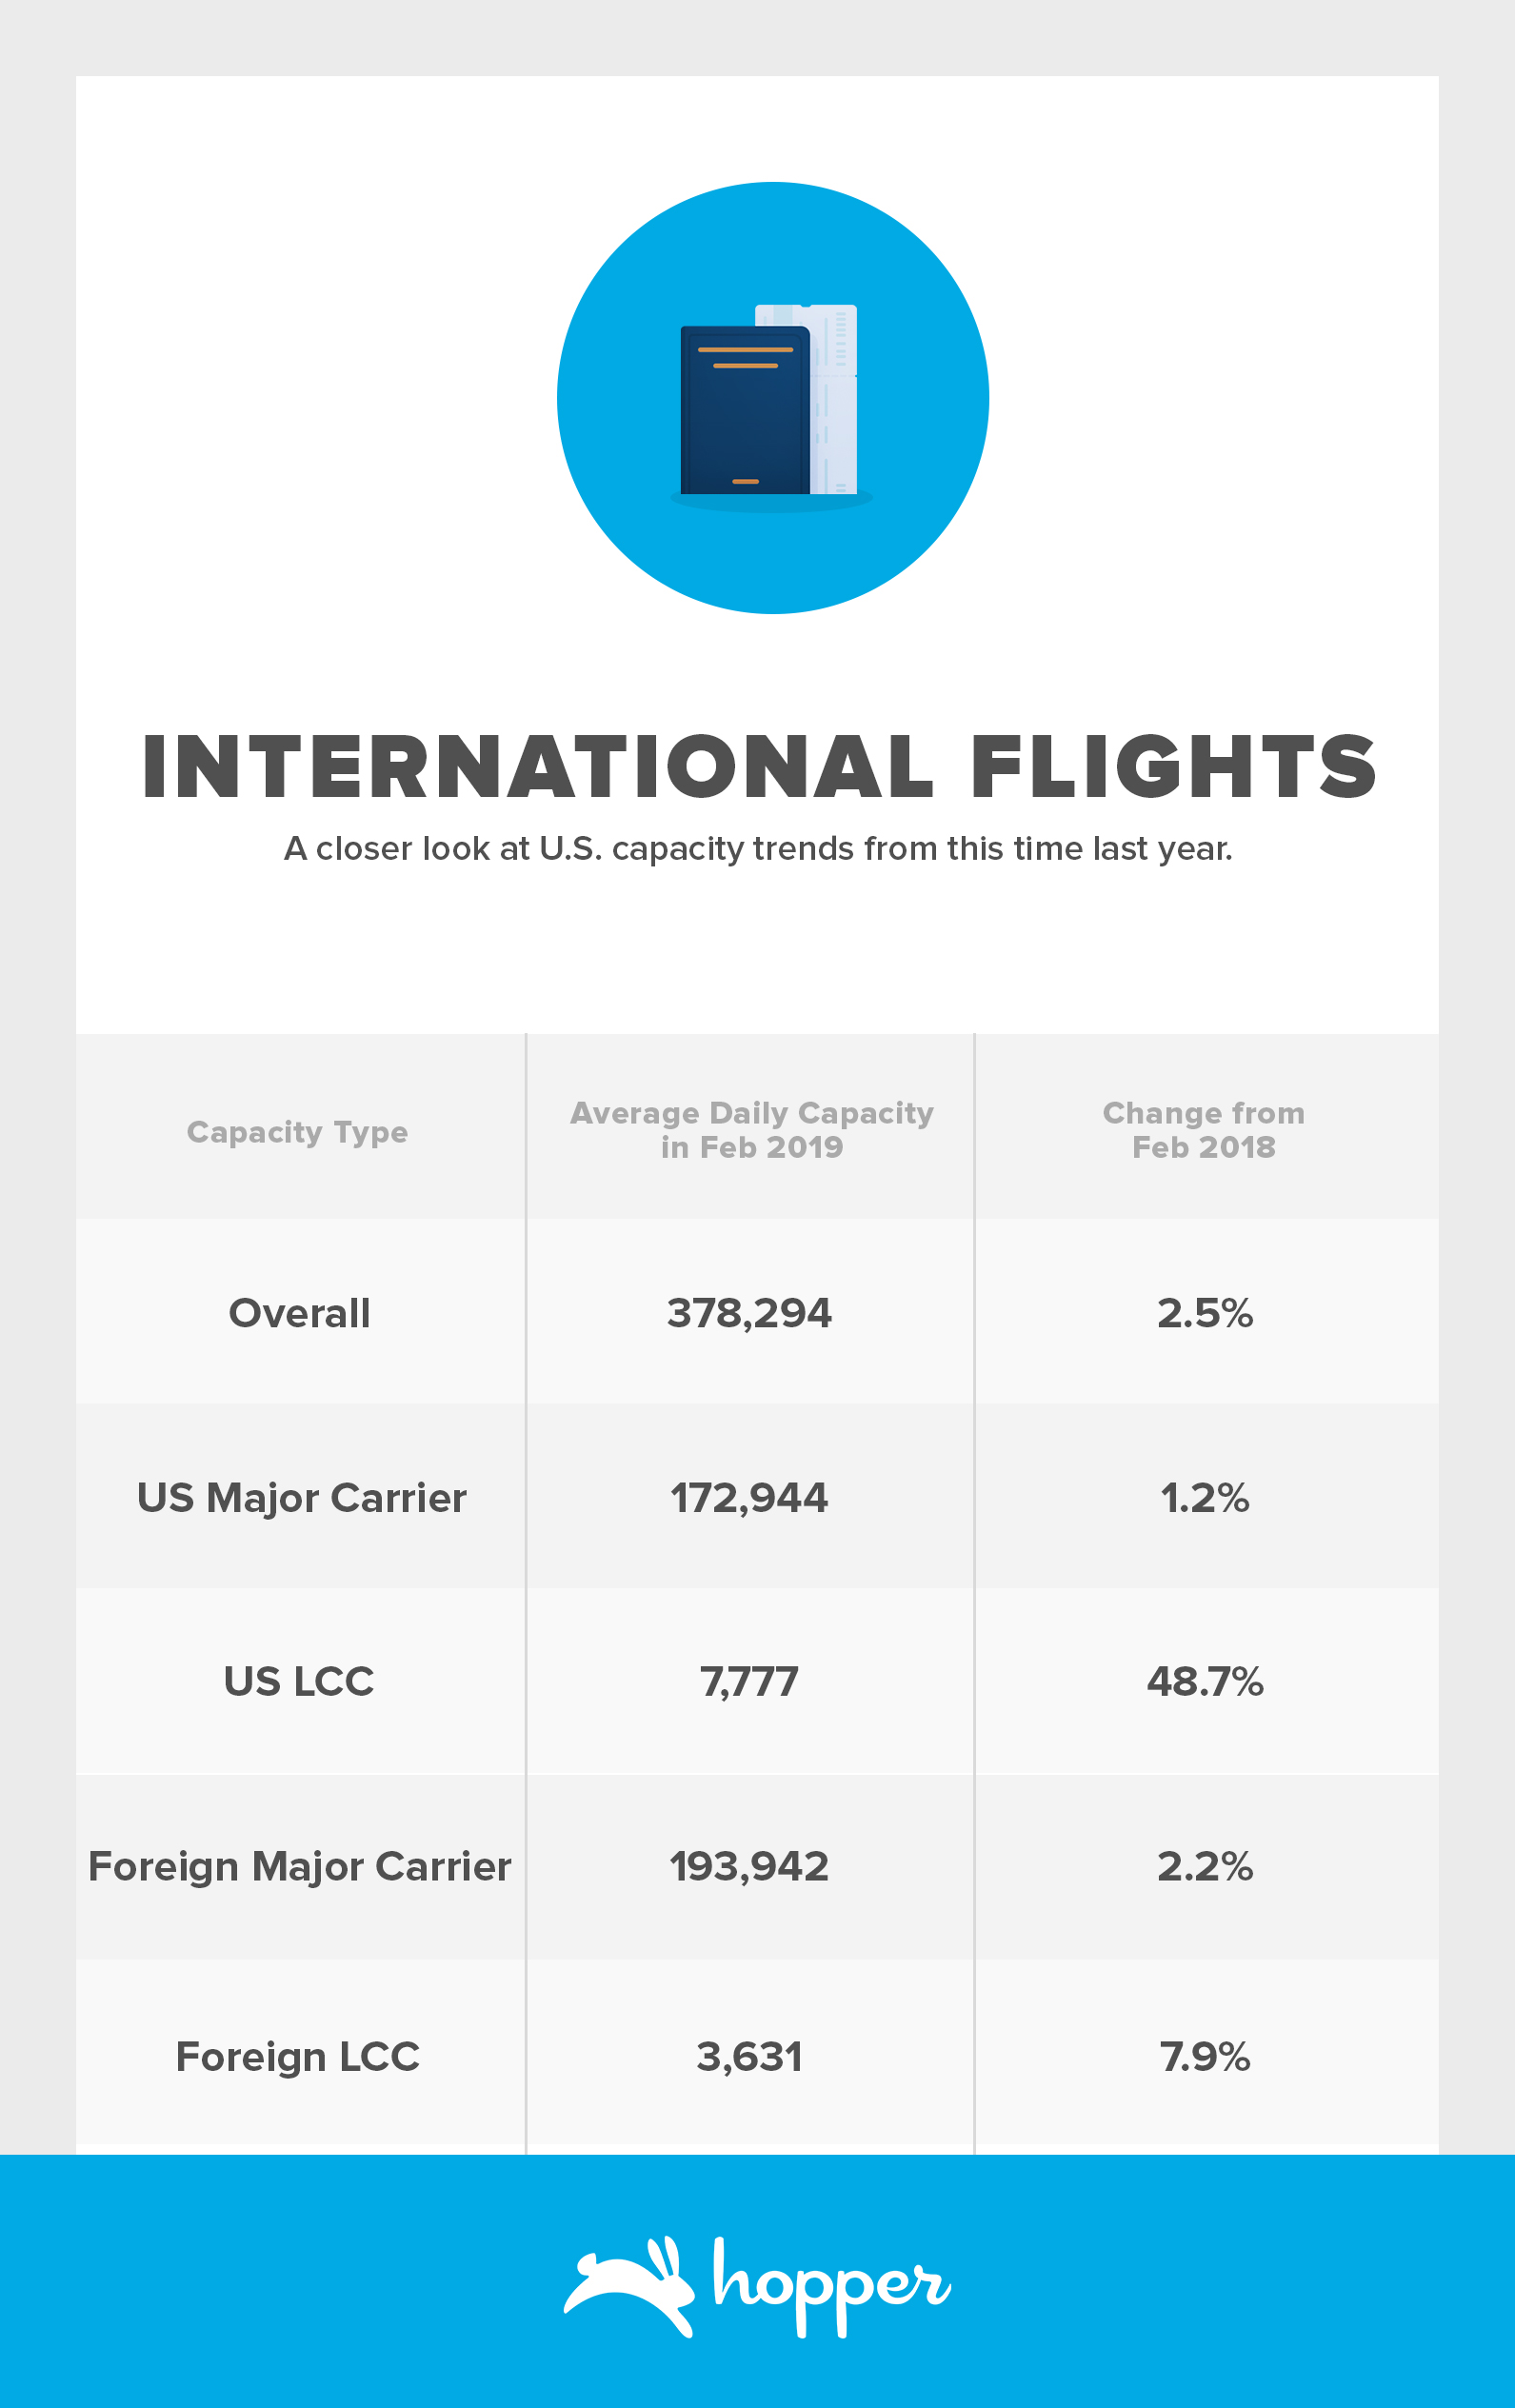
<center> Table 5: International Capacity Trends</center>
Methodology
Our Consumer Airfare Index combines search data for every origin and destination in the United States, providing a near real-time estimate of overall airfare prices - unlike other comparable indices that can lag by several months.
Our Consumer Airfare Index represents the price of tickets available for purchase in a given month, not necessarily for travel in that month. Since travel prices are represented in both time dimensions -- time of purchase and time of travel -- it can be difficult to interpret price dynamics. We use date of purchase because it reflects the price consumers are paying at a given point in time, and we report it alongside the typical advance purchase date to give an idea of how these prices translate into travel dates.
Other indices simply take the average of all fares to represent overall price which skews the results toward expensive fares and can give an unrealistic impression of the true cost of flying. We instead use what we consider to be a “good deal” for each route to reflect what consumers should reasonably expect to pay.
Since our index is constructed and forecasted at the origin-destination level, we can also provide comparable estimates for any combination of routes and extract insights on pricing not only across time, but also across different markets. We use monthly passenger data from the Bureau of Transportation Statistics to ensure that each domestic route is properly represented in the final index based on its share of total passengers.
When predicting future prices, we also consider a few key features of airline pricing. First, prices within a given route will fluctuate with the number of passengers.
Second, prices change predictably with the seasons, especially during the peaks of summer and holiday travel. Of course, much of this variation has to do with increased demand - but in peak travel seasons, airlines can raise prices not only because there are more people interested in traveling, but also because the average traveler is willing to pay more for their summer vacation or trip home for the holidays.
Finally, changes in prices may persist, especially if there are underlying conditions pushing prices up or down, as these effects may be spread over several months. Conversely, the opposite may be true - after a big price increase or drop, fares are more likely to change in the opposite direction in future months. Since dynamics like these and the above aren’t always consistent, we evaluate future prices at the origin-destination level to capture the unique properties of pricing for different routes.
Of course, predicting the future is no easy task, and many factors that influence pricing are simply unforeseeable. However, by exploiting the factors that are predictable, like trends in passenger distribution, seasonal variation, and recent price activity, it’s possible to extract insights about the near future of pricing.
The capacity section looks at total scheduled seats across major carriers and low cost carriers (LCC’s). US Domestic Flights includes all scheduled seats on flights within the United States and US International Flights includes all scheduled seats on flights between the United States and destinations outside of the United States.
Historical Analysis and Comparisons
Our index generally tracks the Bureau of Labor Statistics’ Airfare Consumer Price Index, which is a related aggregation of the prices consumers pay to fly but is more strongly influenced by more expensive business-oriented travel. It’s also released on a more delayed schedule than our index.
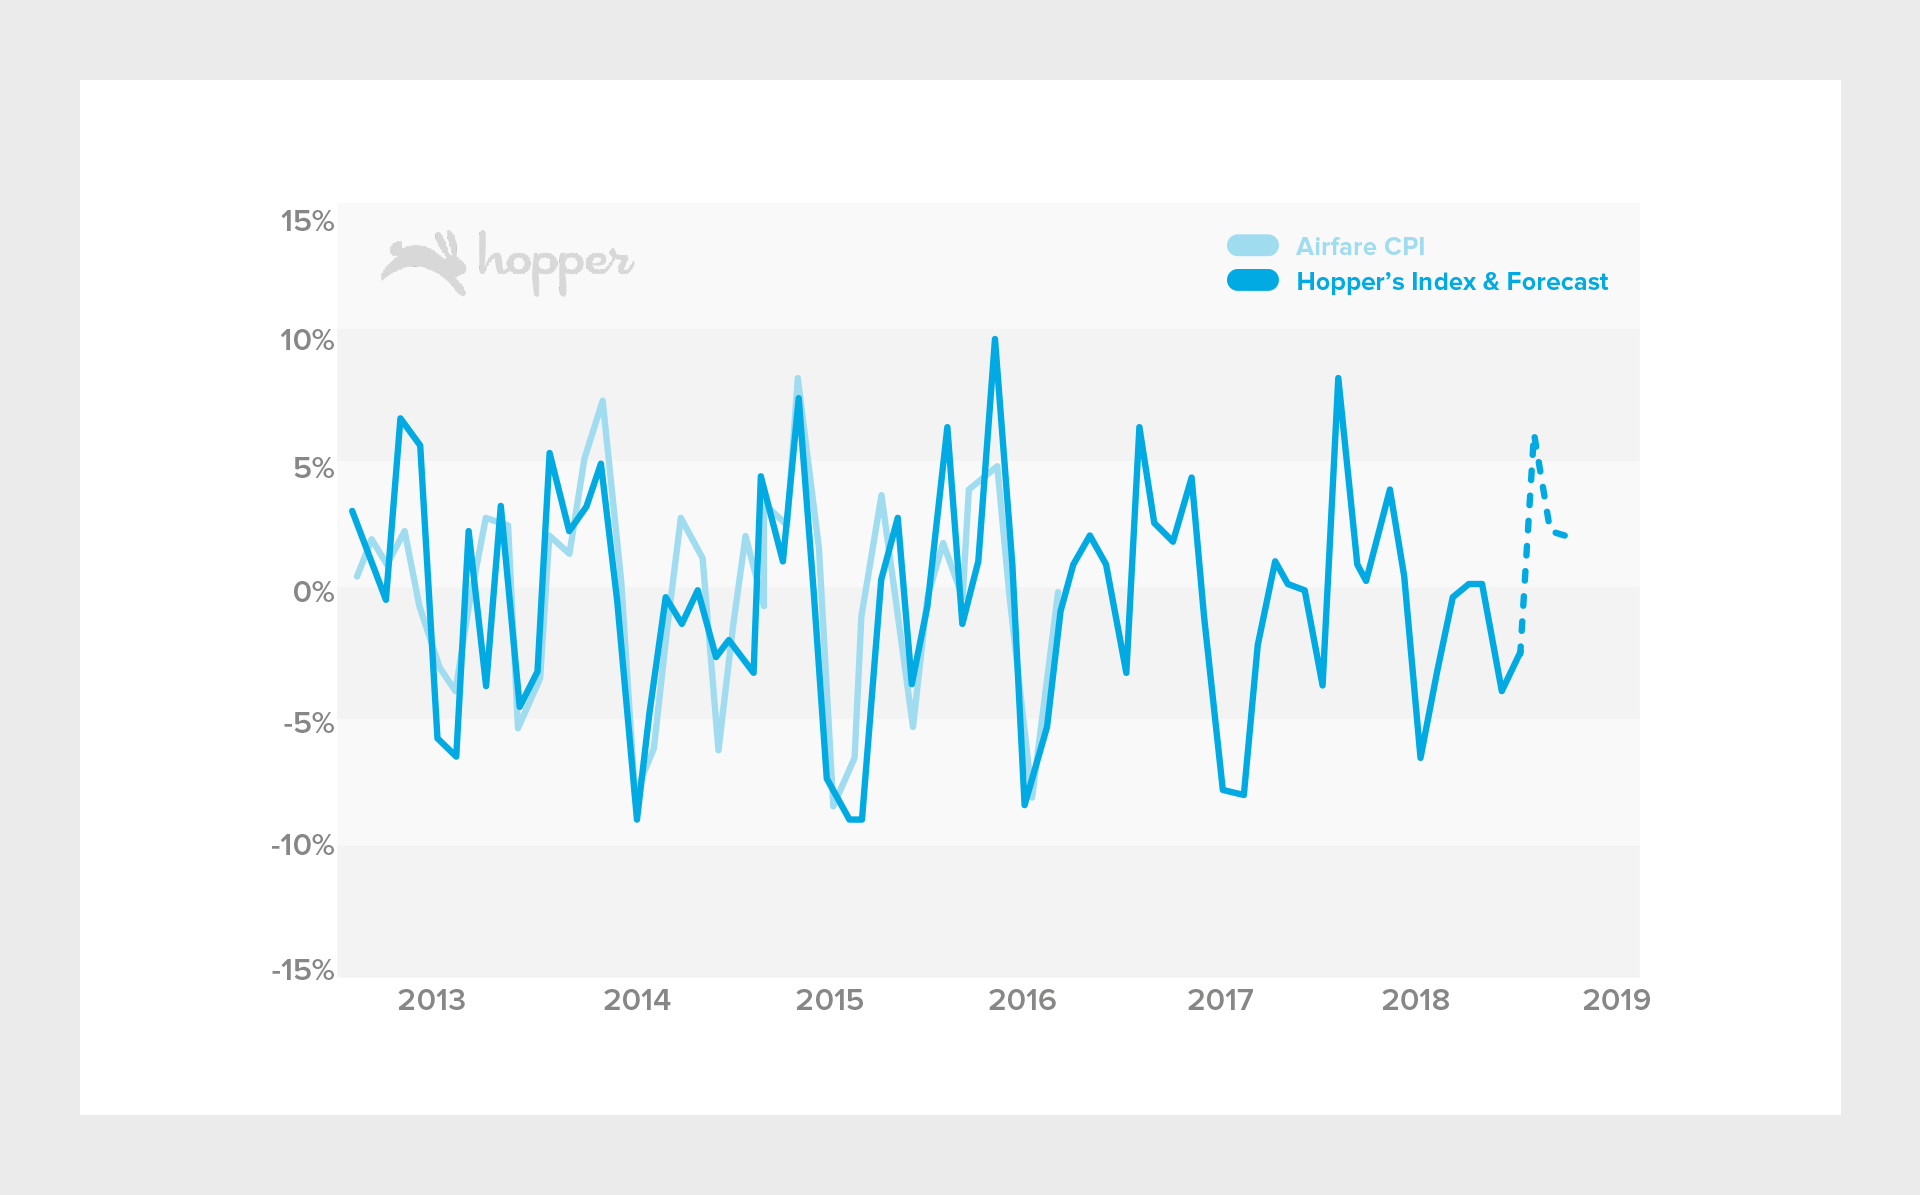
<center> Figure 4: Comparing monthly changes measured by Hopper’s consumer airfare index with the BLS airfare consumer price index.</center>
Get the Hopper app to find the best deals.
You could save up to 40% on your next flight!
