Consumer Airfare Index Report - Q2 2022
Travel prices are on the rise over the last month – in fact, at $330 round-trip, domestic airfare is up 40% from the beginning of the year. Airfare will continue to rise 10% through May up to $360/round-trip.

Hayley Berg - Fri Apr 01 2022
Summary:
Airfare Pricing Trends
Current Airfare
At $330/round-trip, domestic airfare is trending 7% above 2019 prices – it is also the highest average domestic airfare we’ve seen since we started collecting this data. International airfare is matching 2019 prices at $810/round-trip.
Six-Month Airfare Forecast
Domestic: In the near-term, we expect prices to remain at ~$320-$330/round-trip until the end of April, before rising 10% through May to $360/round-trip. Following June, airfare should seasonally decline into the fall shoulder season.
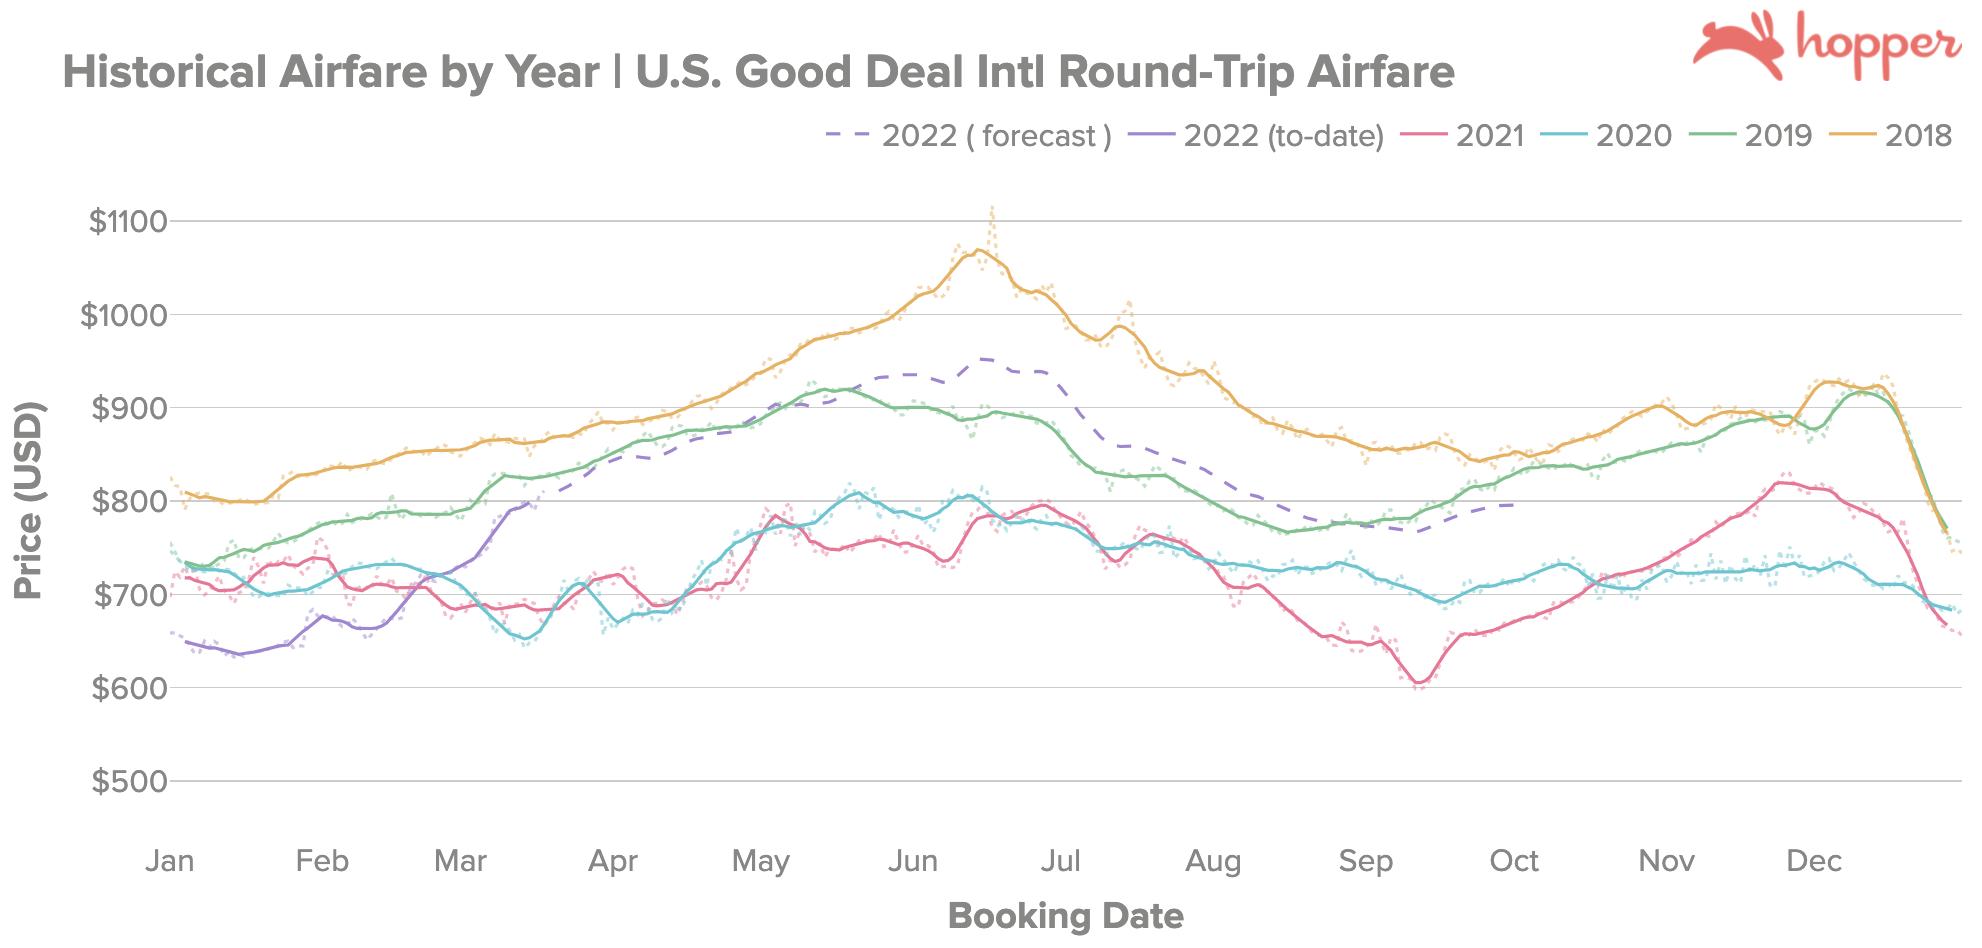
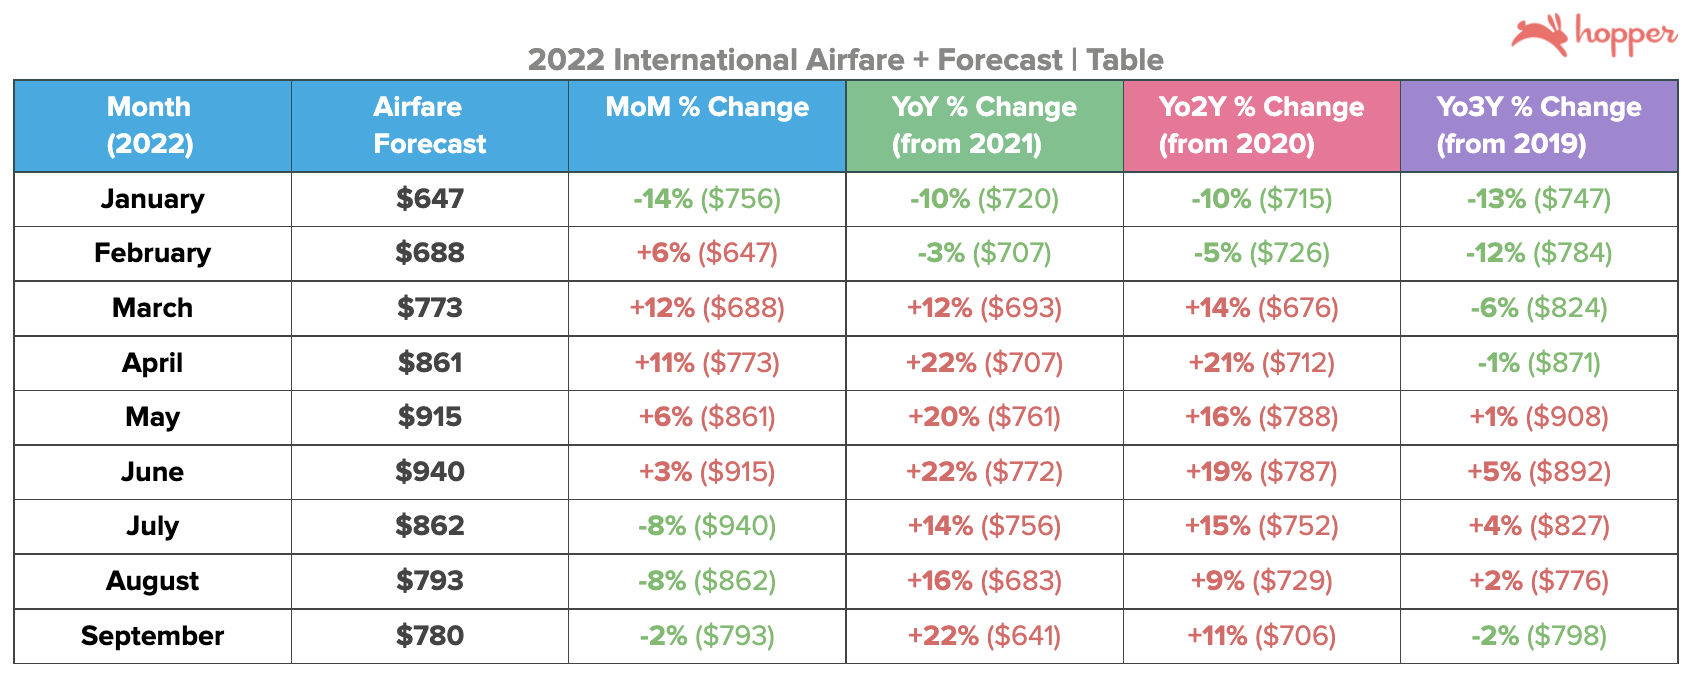
International: We are forecasting international airfare to match 2019 prices through May before rising toward $940/round-trip in June, amounting to a 15% increase from current prices and reaching about 5% above 2019 prices in June, before declining seasonally into the fall.
Where are Travelers Going? (Late Spring / Early Summer)
Most Popular Searches (Where are most people thinking of going?)
Domestic: New York City, NY (#1), Las Vegas, NV (#2), and Orlando, FL (#3) topped the most popular destinations in searches for domestic flights.
International: London, UK (#1), Paris, France (#2), and Cancun, Mexico (#3) were our most searched international destinations again this quarter.
Trending Searches (What’s rising the quickest in search interest?)
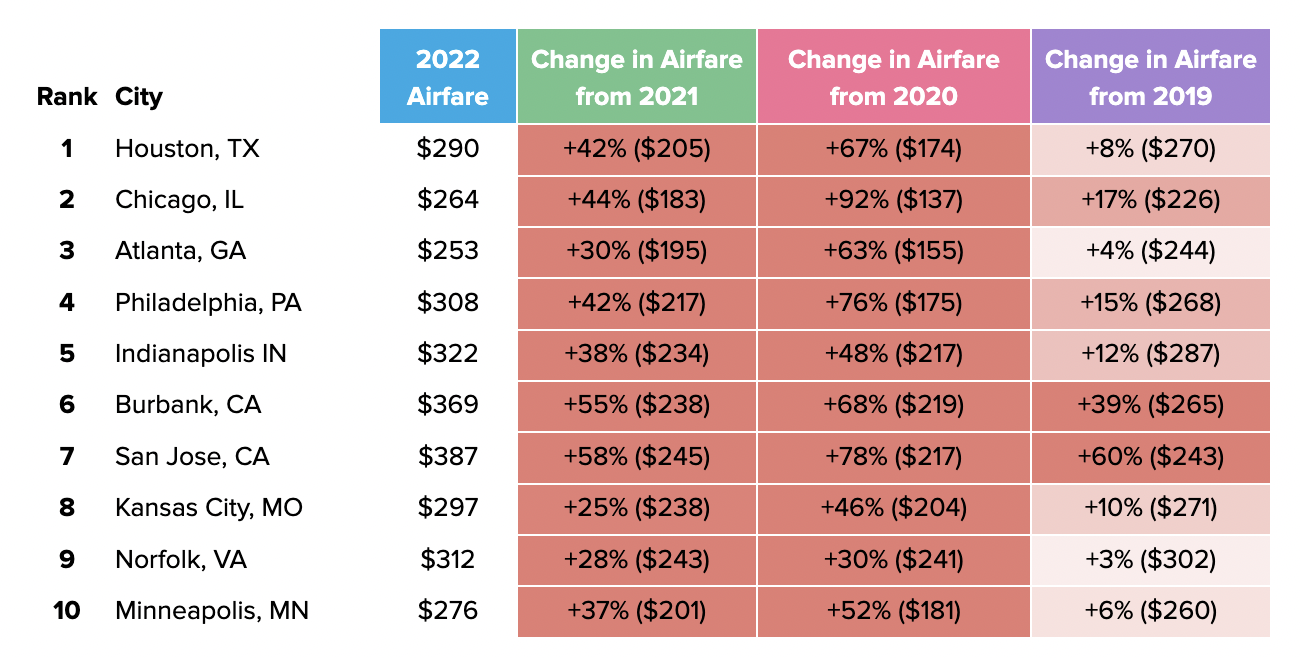
Domestic: Houston, TX (#1), Chicago, IL (#2), and Atlanta, GA (#3) were the highest trending domestic destinations for the late spring / early summer.
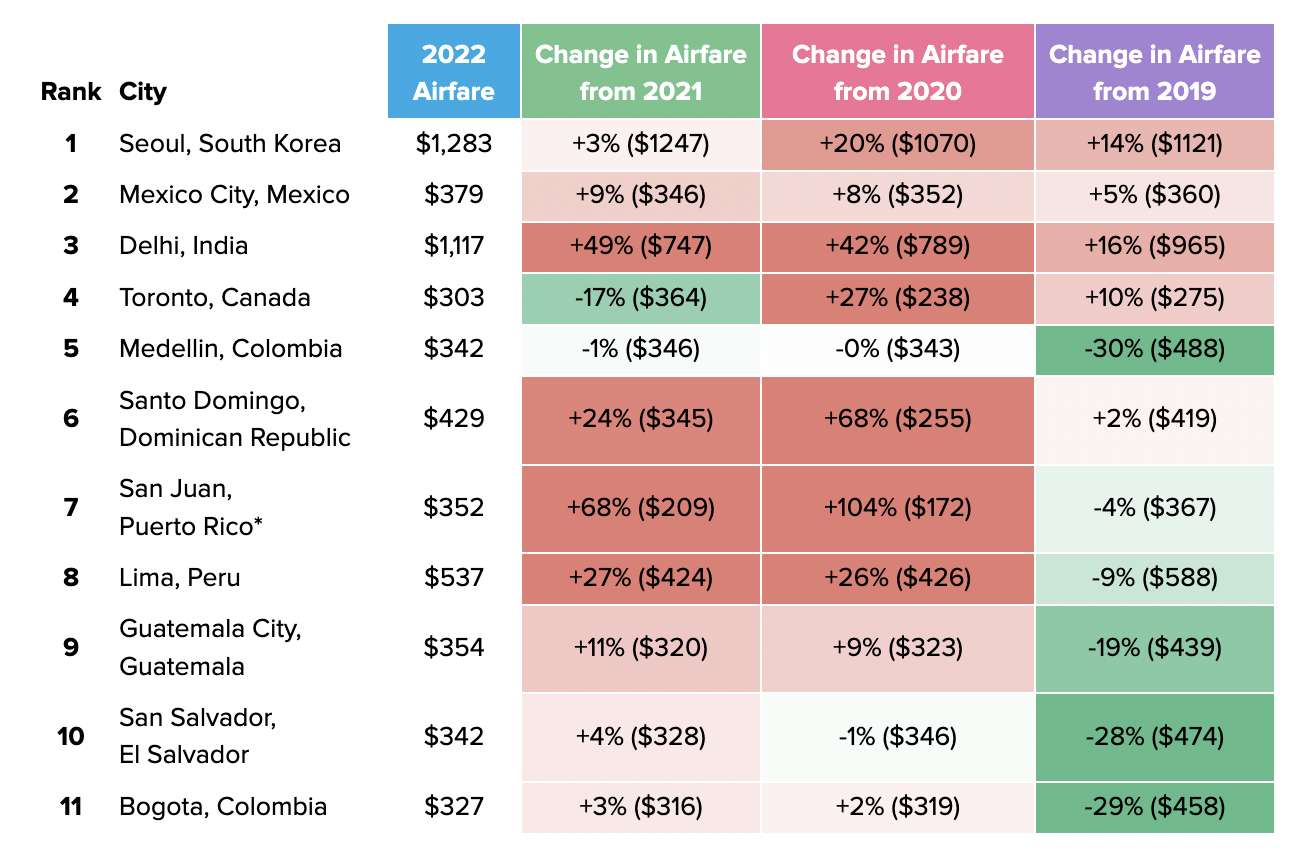
International: Seoul, South Korea (#1), Mexico City, Mexico (#2), and Delhi, India (#3) were the highest trending international destinations.
Most Popular Bookings (Where are Hopper users headed?) Since Hopper users tend to skew towards younger leisure travelers, our bookings also tend to reflect this demographic’s interests.
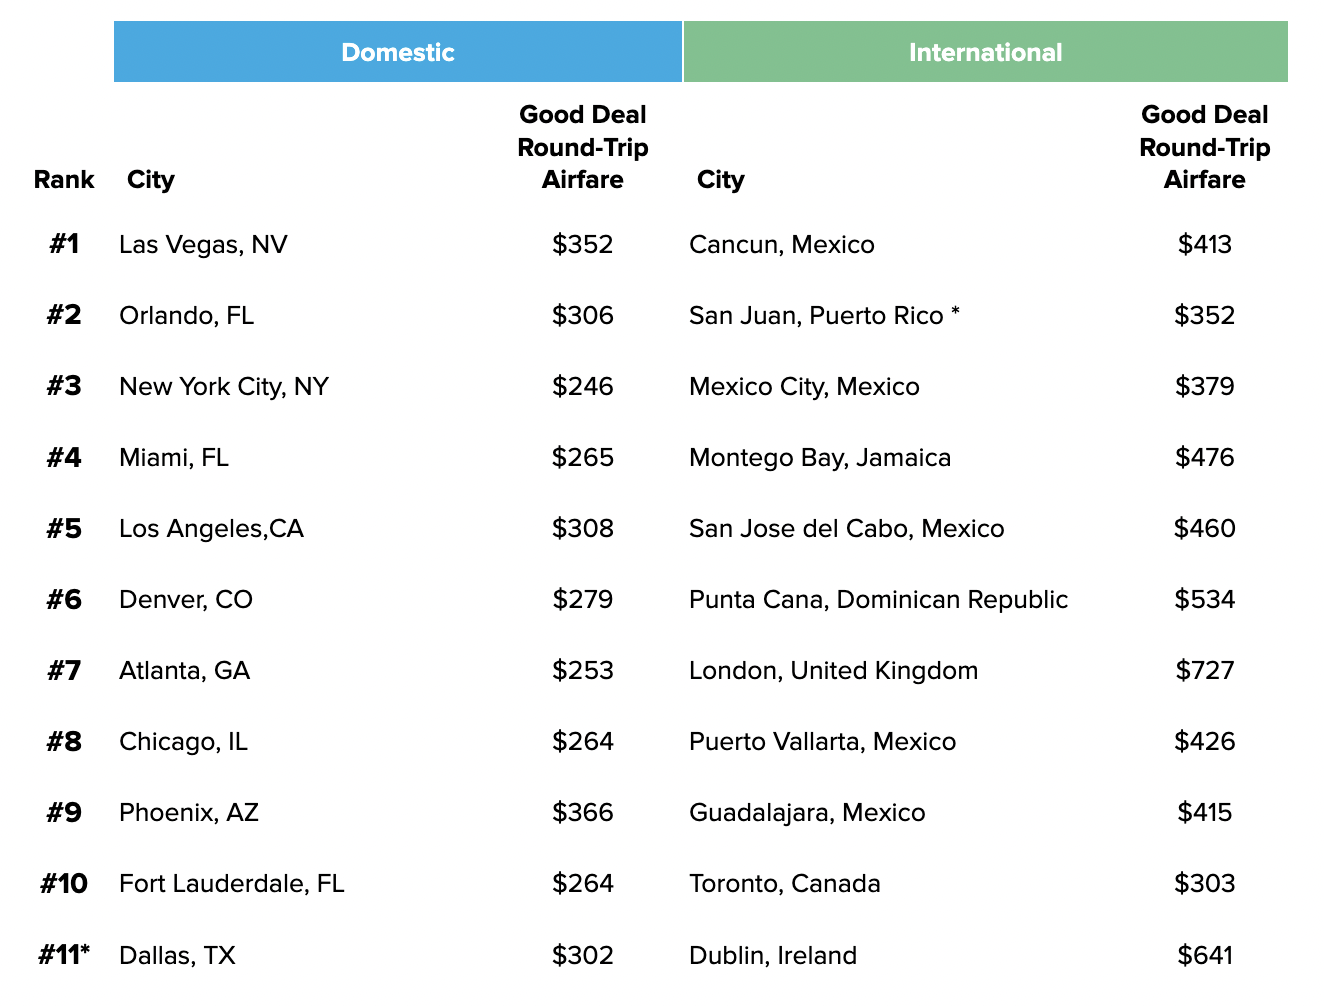
Domestic: Las Vegas, NV (#1), Orlando, FL (#2), and New York City, NY (#3) were the most booked domestic destinations among our users.
International: Cancun, Mexico (#1), San Juan, Puerto Rico (#2), and Mexico City, Mexico (#3) were the most booked international destinations among our users.
Search Traffic + Demand Trends
When is Demand Clustering in 2022?
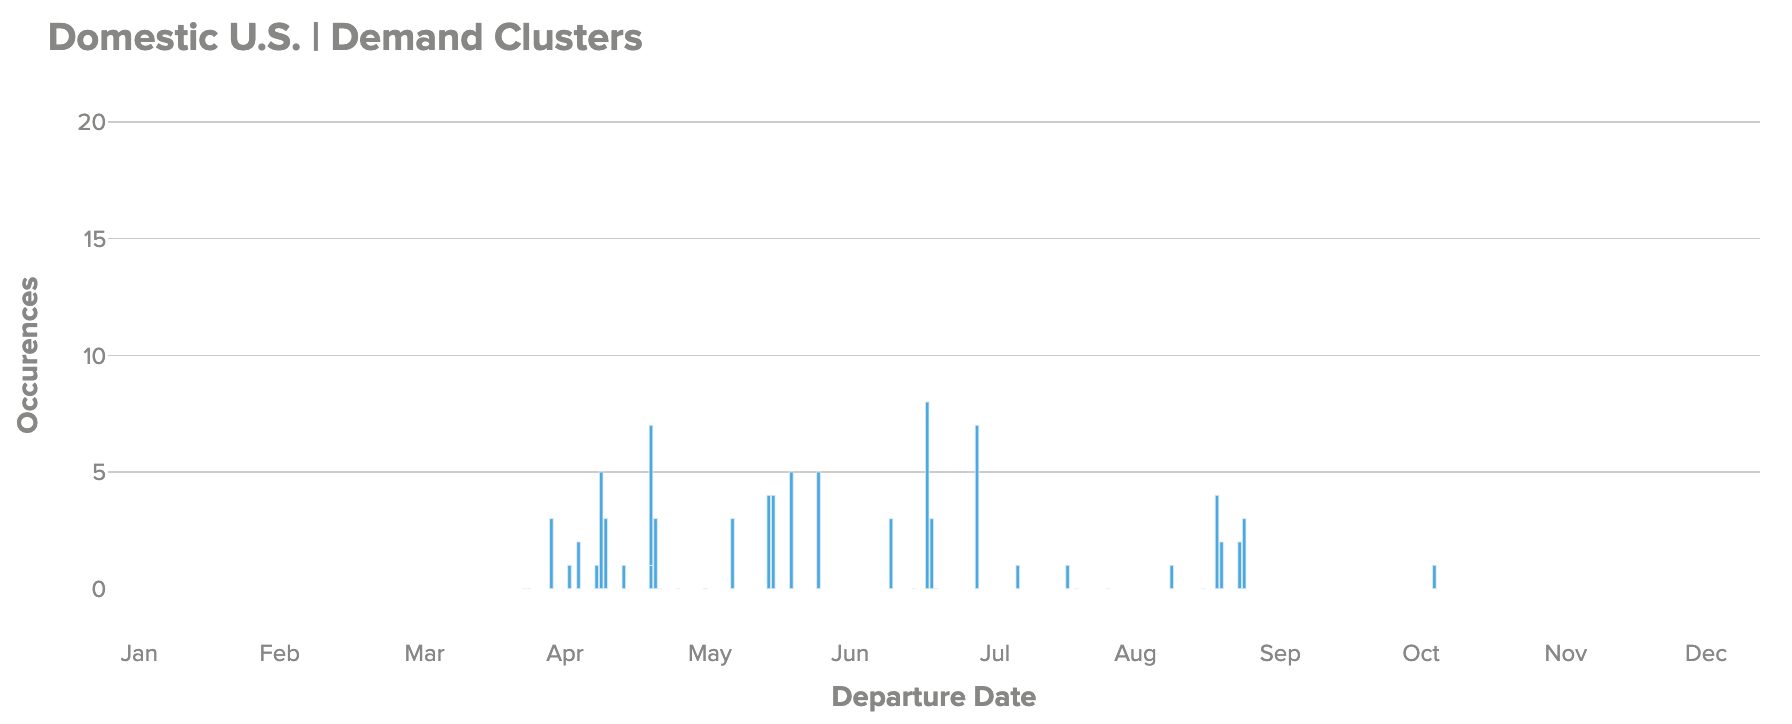
Domestic: Going forward in the domestic market, we’re seeing demand cluster in mid-April, but otherwise it is mostly concentrated around national holidays such as Memorial Day, July 4th, and Labor Day.
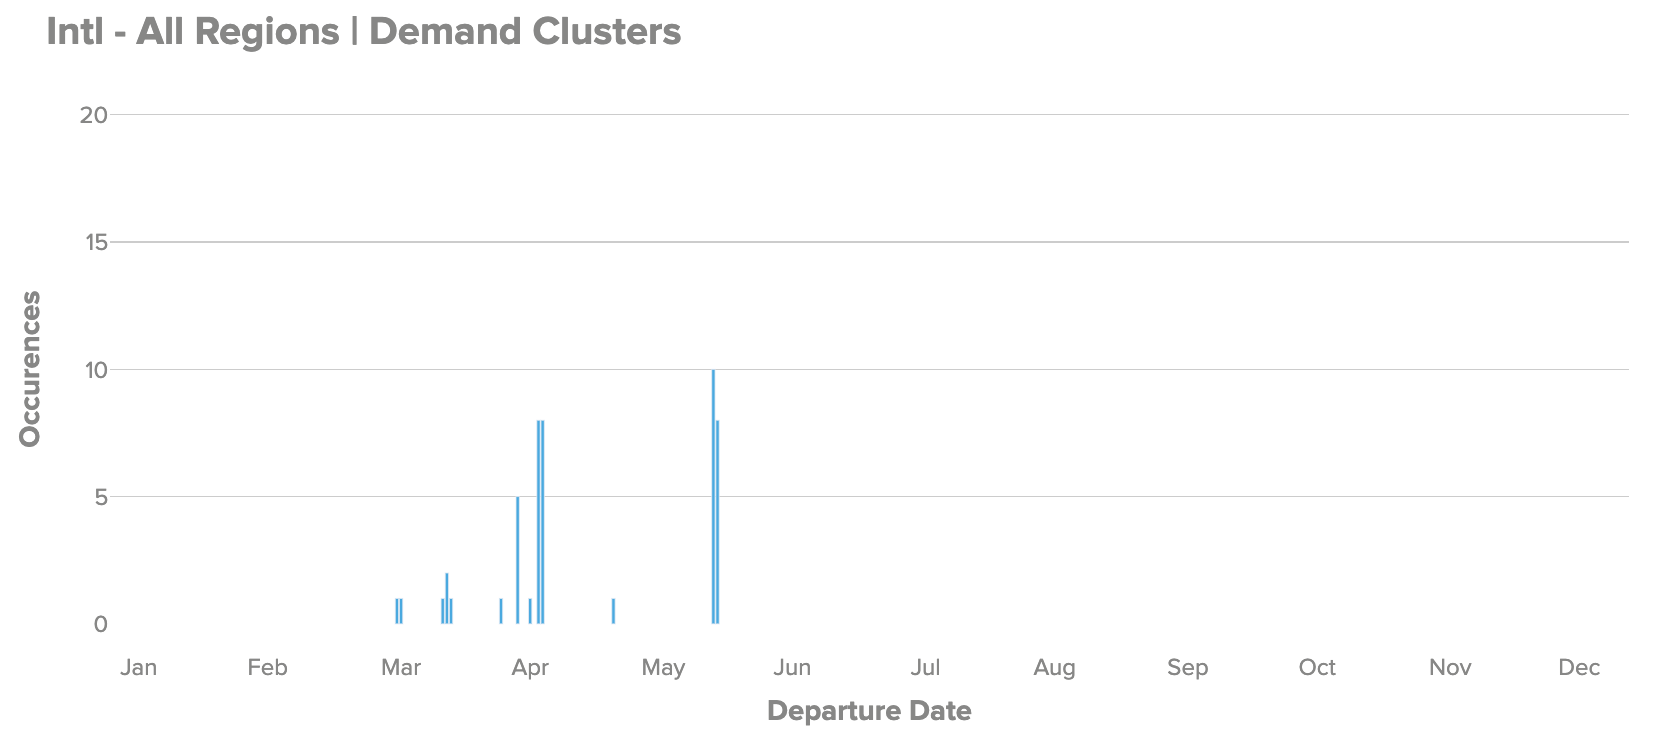
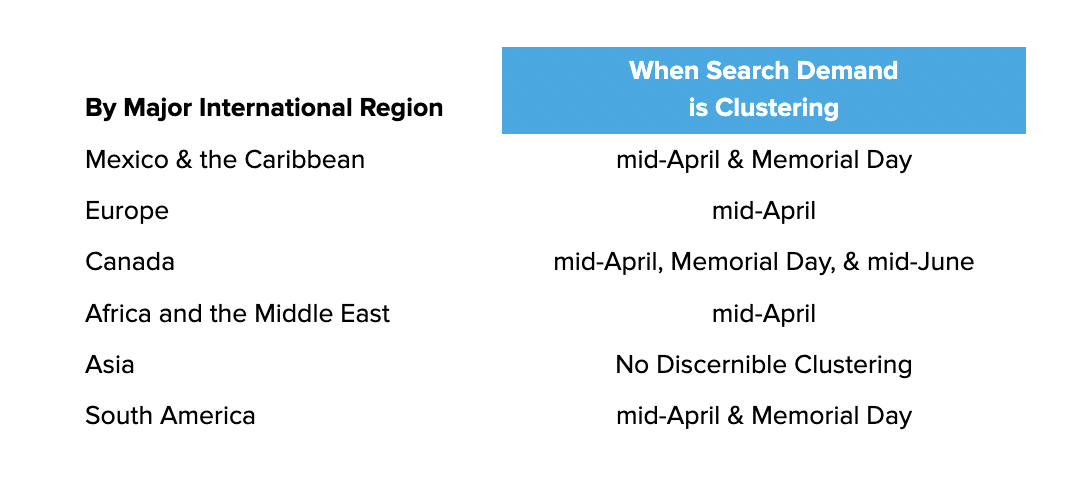
International: International search demand has fewer discernible clusters aside from mid-April and Memorial Day weekend. We detail clusters for each major international region below.
How far are travelers booking in advance? Travelers continue to book closer to their dates of travel relative to pre-pandemic 2019 in an environment where there can be greater uncertainty about how the pandemic and corresponding travel restrictions may develop in the coming months.
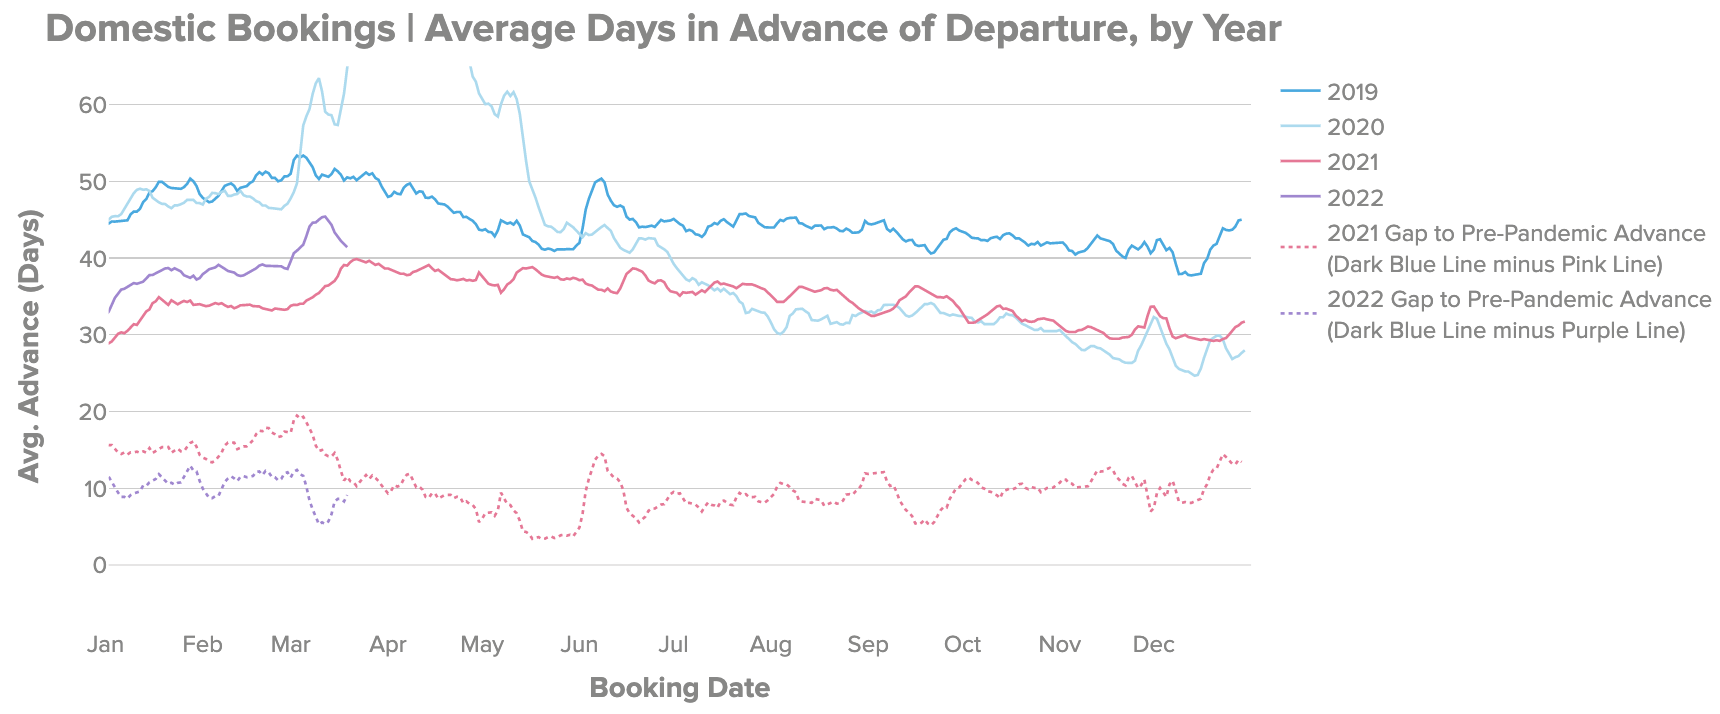
Domestic: Travelers are booking domestic flights 41 days in advance on average, down from 50 days this time in March 2019, and about the same as this time last year in March 2021.
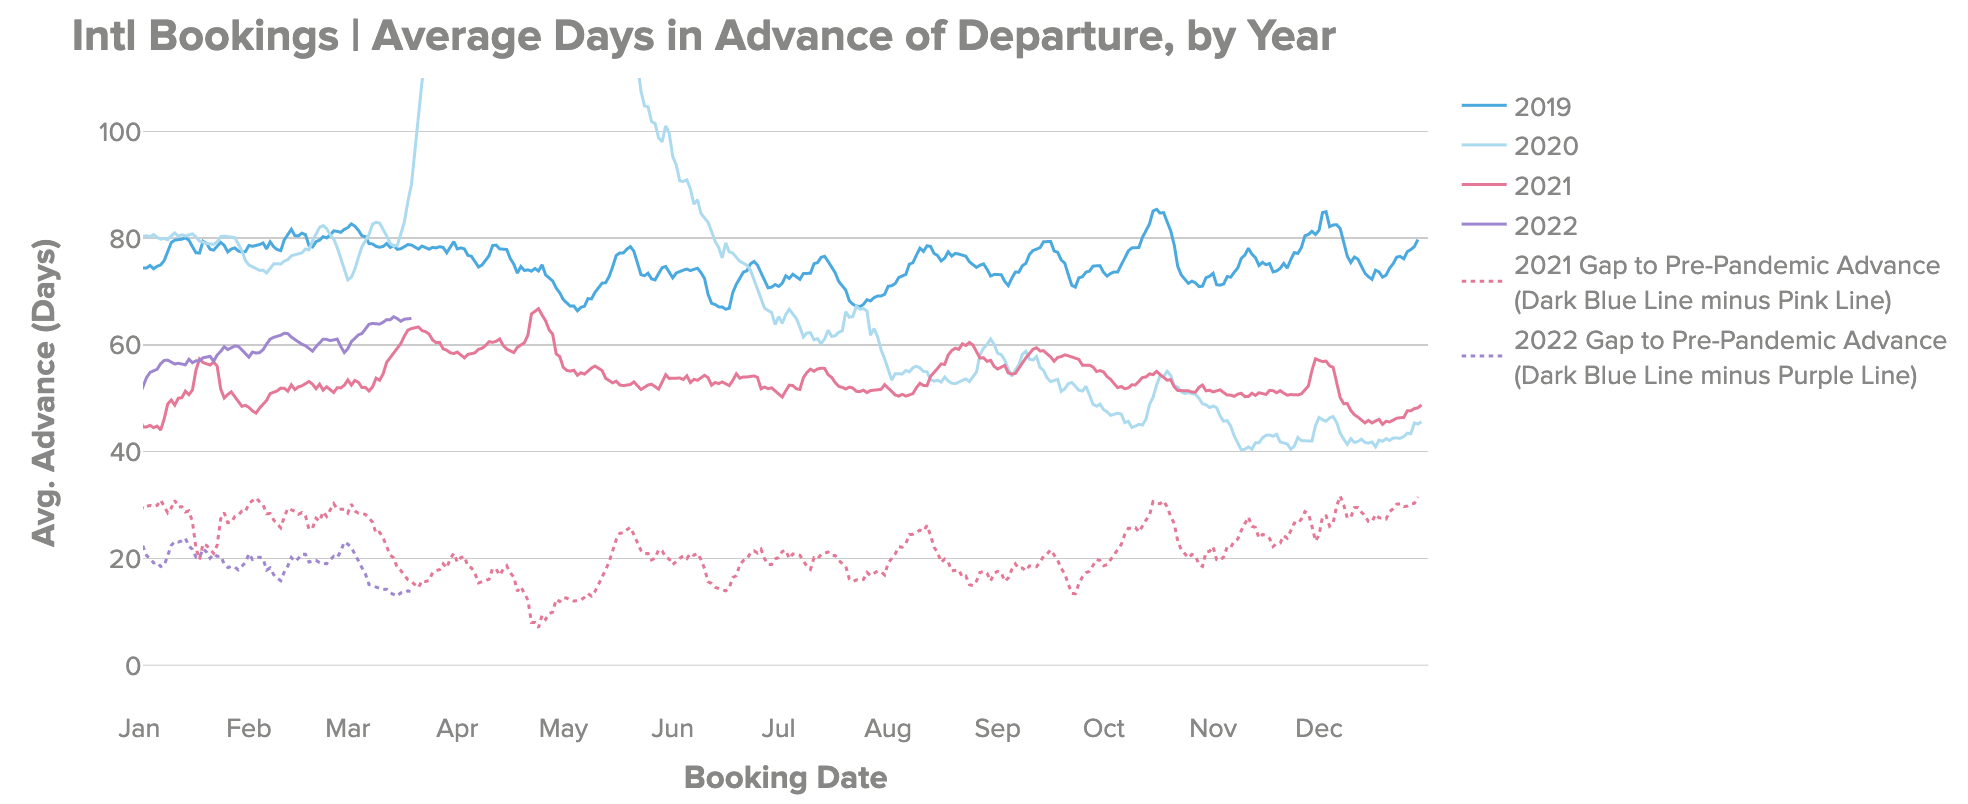
International: Travelers are booking international flights 65 days in advance on average, down from 79 days this time in March 2019, and about the same as this time last year in March 2021
Airfare Pricing Trends
Price of Jet Fuel
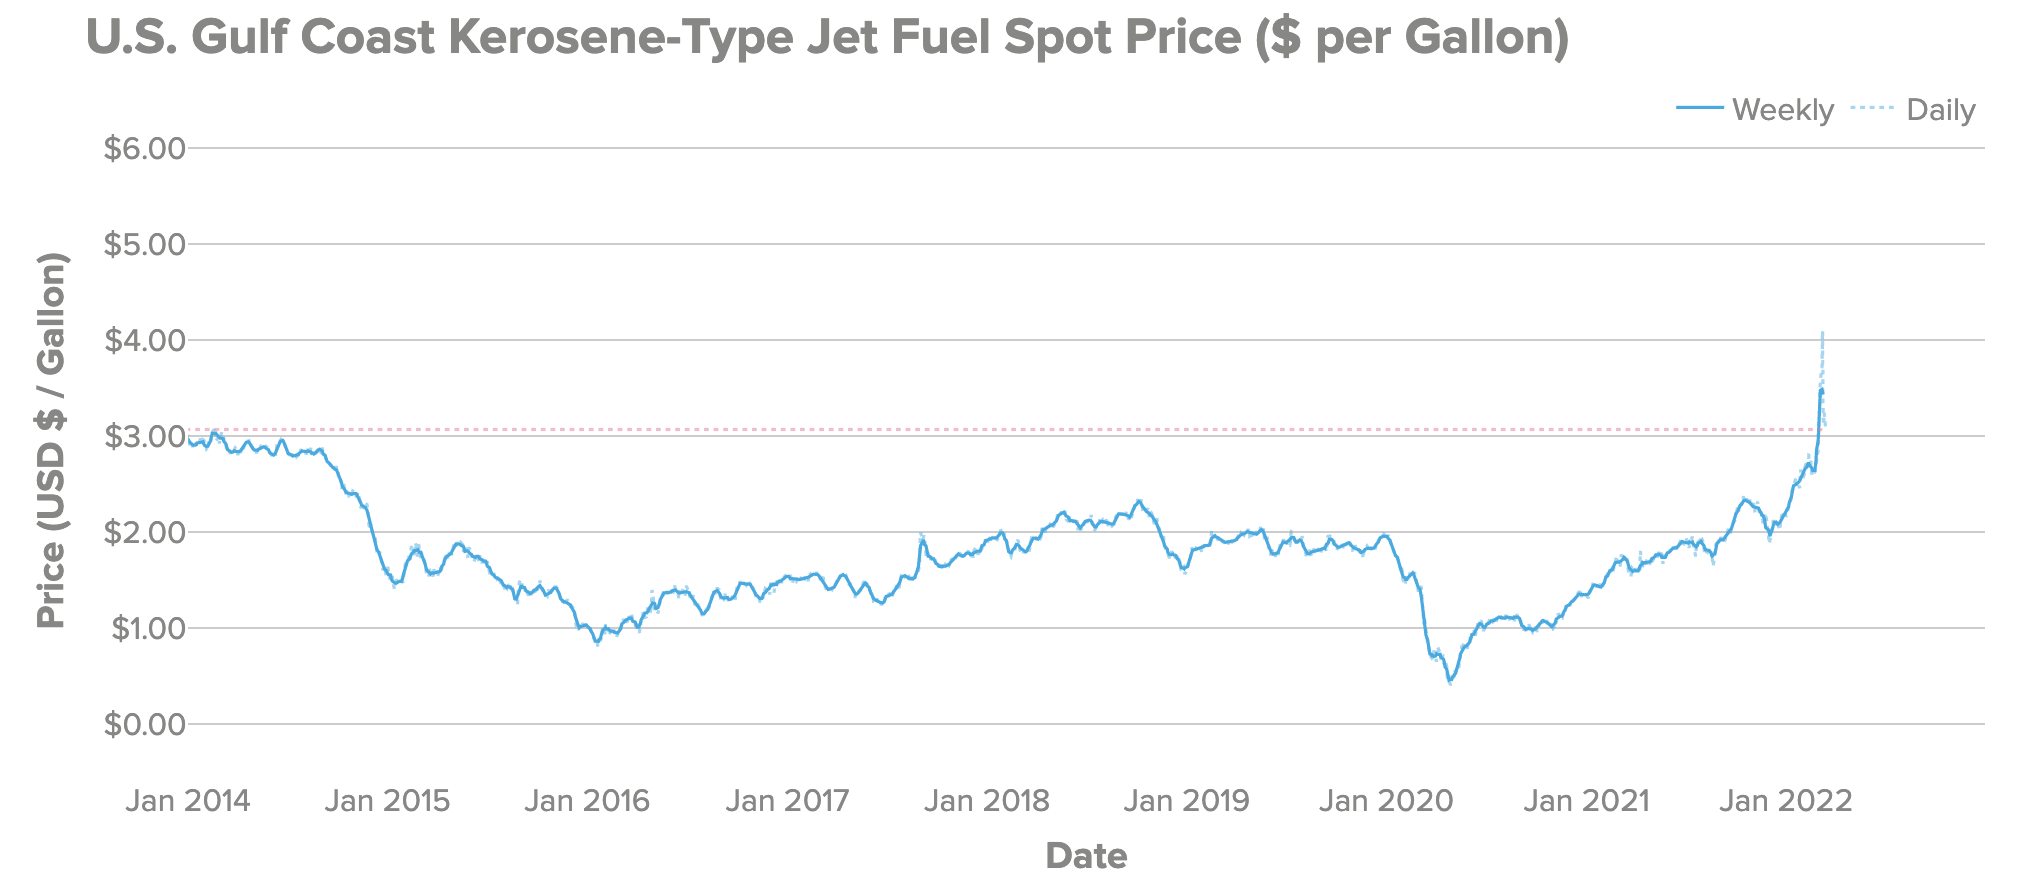
The price of jet fuel according to the EIA is currently $3.07/gallon, the highest prices we’ve seen since January 2014–up 40% from $2.20/gallon at the start of 2022 and up 76% YoY from the same time in March 2021. Amidst speculation of potential crude oil shortages at the outbreak of the Russian/Ukraine conflict, jet fuel spiked as high as $4.10/gallon in early March. Usually price increases in jet fuel take a few months to show up in airfare, and the extent to which it appears can vary depending on airlines’ hedging programs and how much of the cost is passed through to the consumer.
Historically jet fuel prices have accounted for 30% of an airlines’ operating expenses, usually the second biggest cost aside from labor. This means back-of-the-envelope that if the full additional cost is passed on to the consumer, a 10% increase in jet fuel prices would (after some lag) result in a 3% increase in airfare. If only half the cost were passed through (and the airline took on the other half of the costs), we’d expect closer to a 1.5% increase in airfare. Since prices are up 40% since the beginning of the year, we’d expect an 8-12% increase in airfare attributable to jet fuel if prices remain at this level, some of which we’ve likely already seen.
TSA Throughput
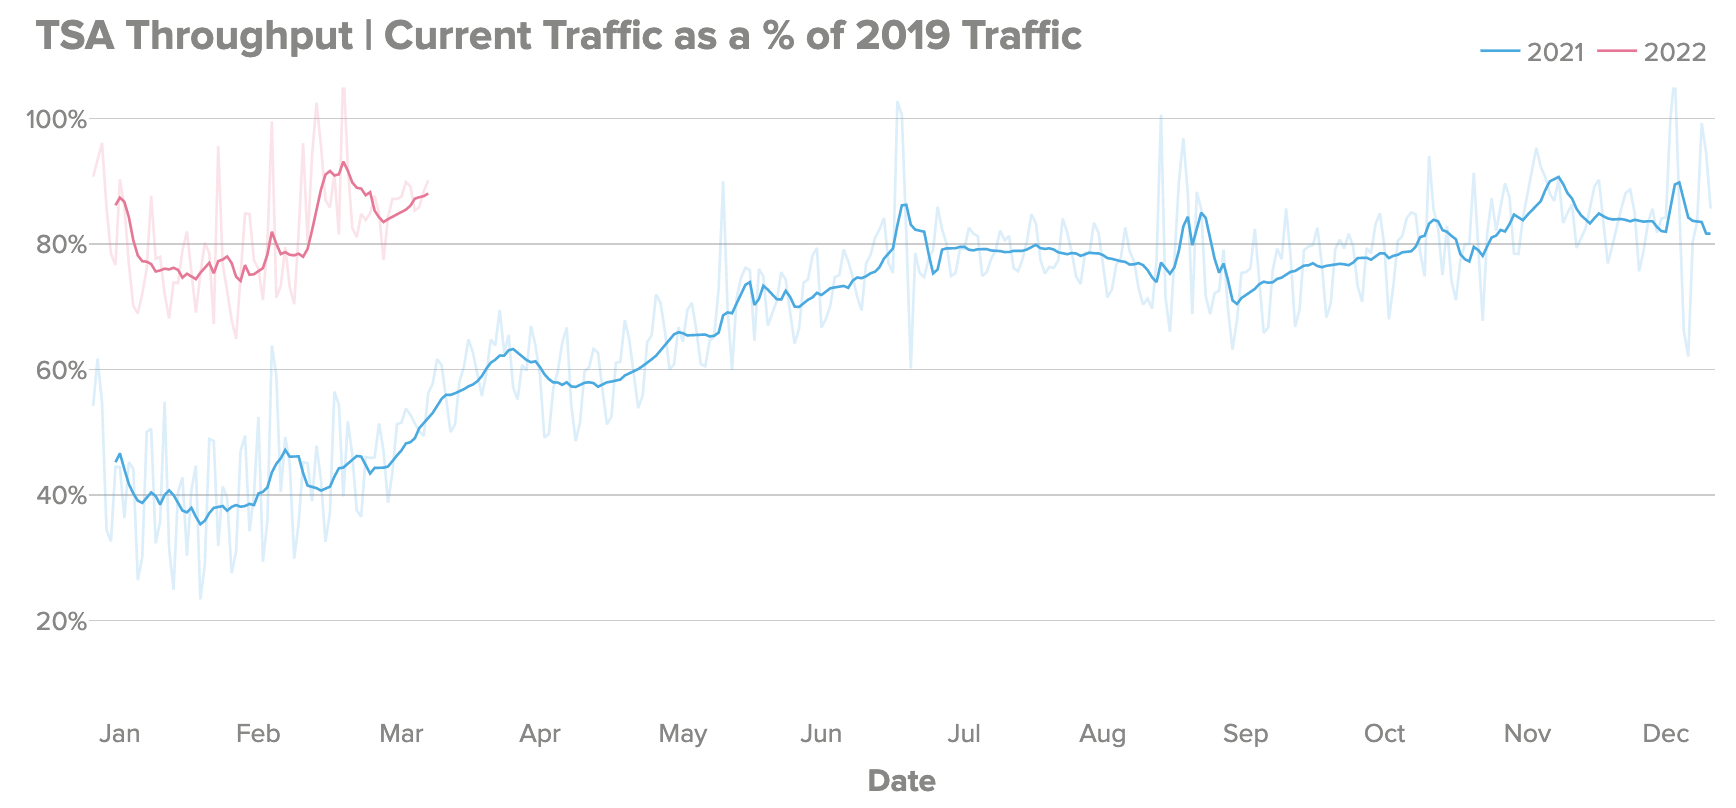
The TSA reports daily passenger travel numbers through U.S. security checkpoints, which we compare to the same time in 2019 adjusted for day-of-week. Currently, the TSA is observing around 88% of 2019 traffic, comparable to heavy passenger traffic in late 2021 just prior to the impact of the Omicron variant. TSA throughput bottomed out in late January and has steadily increased since the long weekend of February 18th, which is when we forecasted seeing travel pick up in our Q1 2022 Index based on flight searches clustering for departure dates around that time. 2.36m passengers on Sunday, March 20th, 2022 was the most seen on a single day since the start of the pandemic.
Domestic Consumer Airfare Prices + 6-Month Forecast
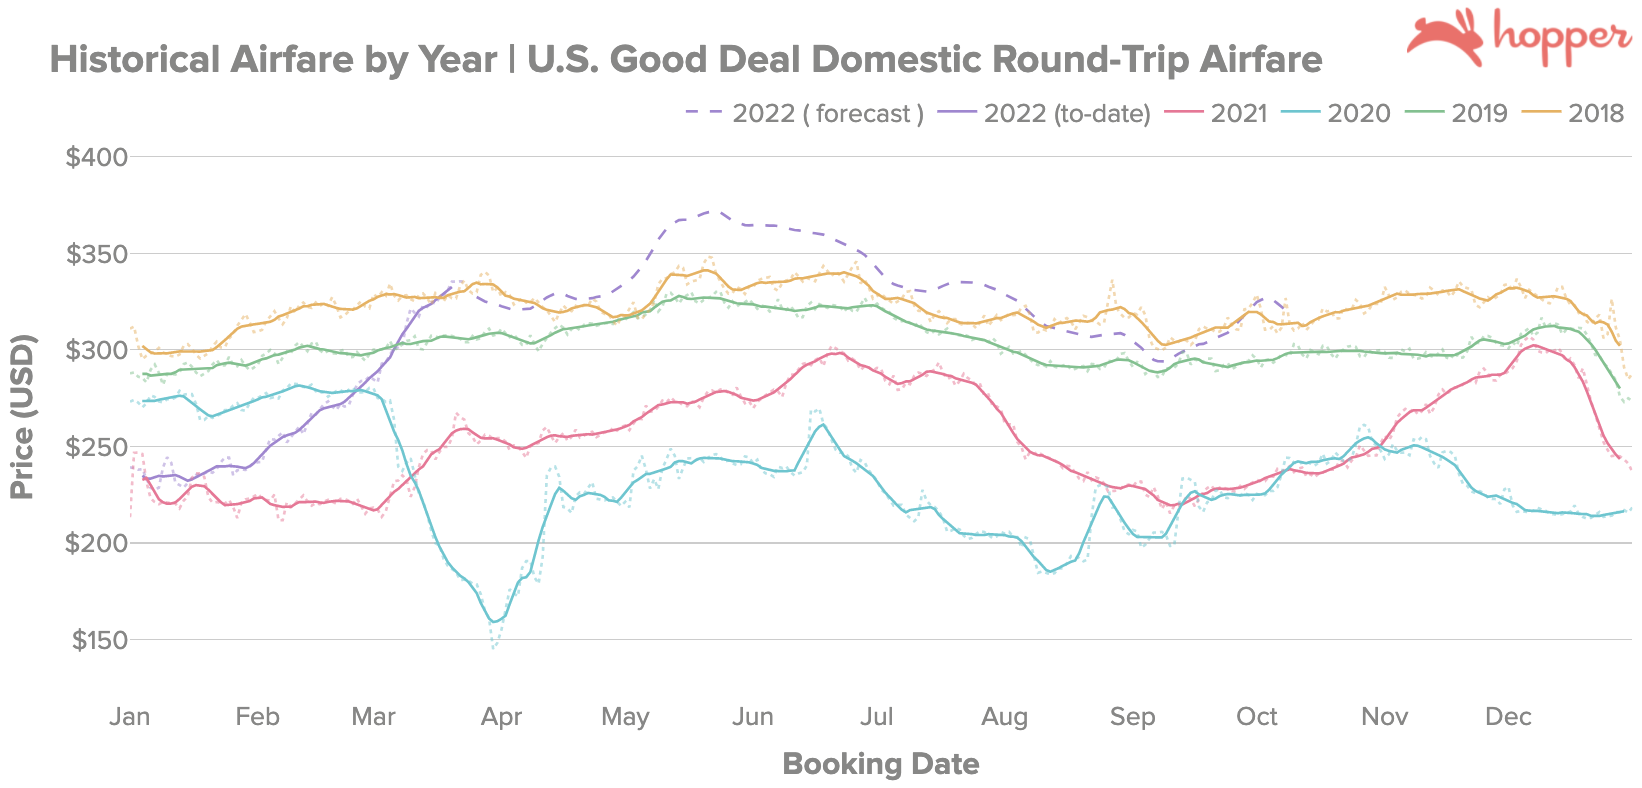
Airfare has steeply risen in the first quarter of 2022, and current prices are up 40% from the start of the year at $235/round-trip. With current domestic airfare at $330/round-trip, this is the highest it’s been since Hopper started tracking this data. By comparison, in 2019 and 2018 airfare increased 7% and 10% respectively over that same period. Airfare is currently trending closer to 2018 prices at this time.
Reflecting on Our Prior Forecast: In our Q1 2022 Index we forecasted domestic airfare to be around $290/round-trip in late March reaching 2019 prices by April, rising an average of 7% a month until May. We ended up surpassing 2019 prices in the first week of March and are currently tracking at 2018 prices. Airfare rose 12% MoM in February and 19% MoM in March, significantly above what we considered an already relatively aggressive forecast for those months. The biggest divergence between our prior forecast and actual airfare occurred in late February, where airfare continued to climb much more steeply than we had forecasted, likely on the back of higher-than-expected jet fuel prices.
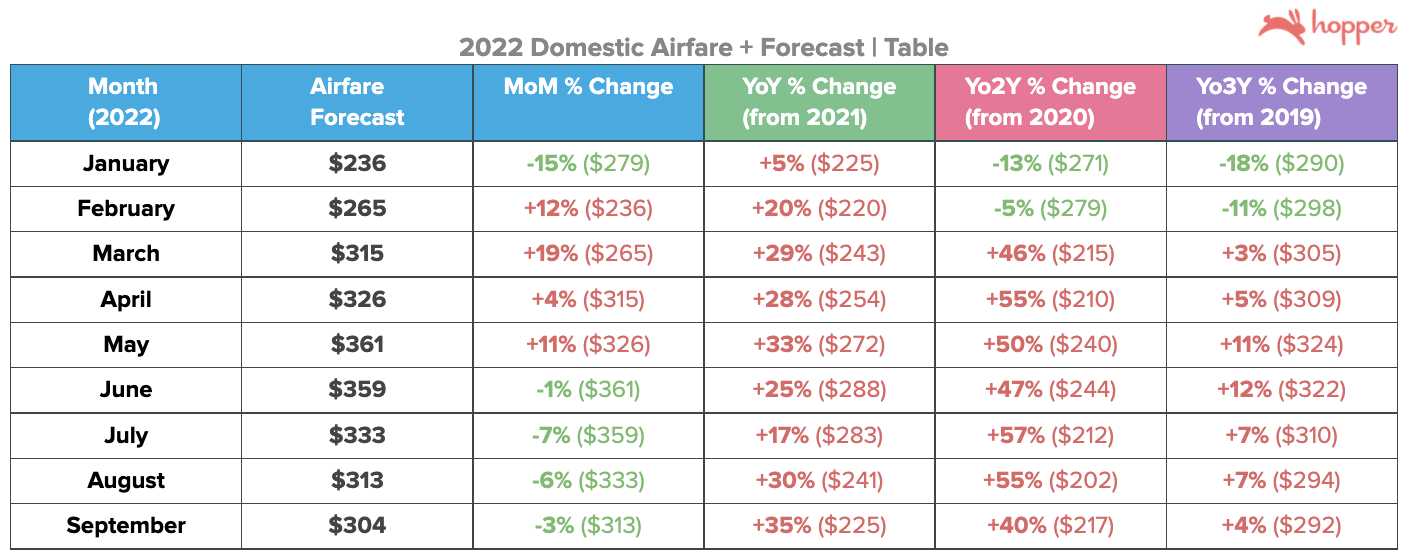
Domestic Airfare Forecast by Month
In the near-term, we expect prices to remain at ~$320-$330/round-trip until the end of April, since spring travel demand seasonally tends to hold steady between March to April. With carriers having to contend with higher jet fuel prices alongside regular seasonally improving demand, we expect airfare to continue to climb to $360/round-trip through May (a 10% increase from current prices) and to remain high into June, before seasonally declining into the fall shoulder season. We would expect this dip to be less pronounced than last year, where the Delta Variant accelerated already seasonally lower demand into the fall.
Factors Affecting Domestic Airfare
We believe that most of the recovery in domestic air travel demand post-Omicron has already played out, meaning that in the coming months we anticipate other factors such as regular seasonal changes in demand, jet fuel prices, capacity, and carrier competition to be the primary drivers of price action in the U.S. market. Note: The emergence of another Covid variant or a deteriorating situation with the Omicron BA.2 subvariant could be detrimental to travel demand, and would significantly affect our forecast. In that scenario, we would likely see a decline in travel demand resulting in lower than forecasted airfares.
Factors Affecting Domestic Airfare
Jet Fuel Prices: Significantly higher jet fuel price is one of the biggest factors impacting airfare in the current environment. Since prices are up 40% since the beginning of the year, we’d expect an 8-12% increase in airfare attributable to jet fuel if prices remain at this level, some of which we’ve likely already seen.
Seasonal Effects: We expect higher seasonal demand will lead to higher airfare approaching the summer months. Lower seasonal demand post-July should help alleviate higher airfares heading into the fall. In 2019, we saw a 9% decrease in airfare between June and September.
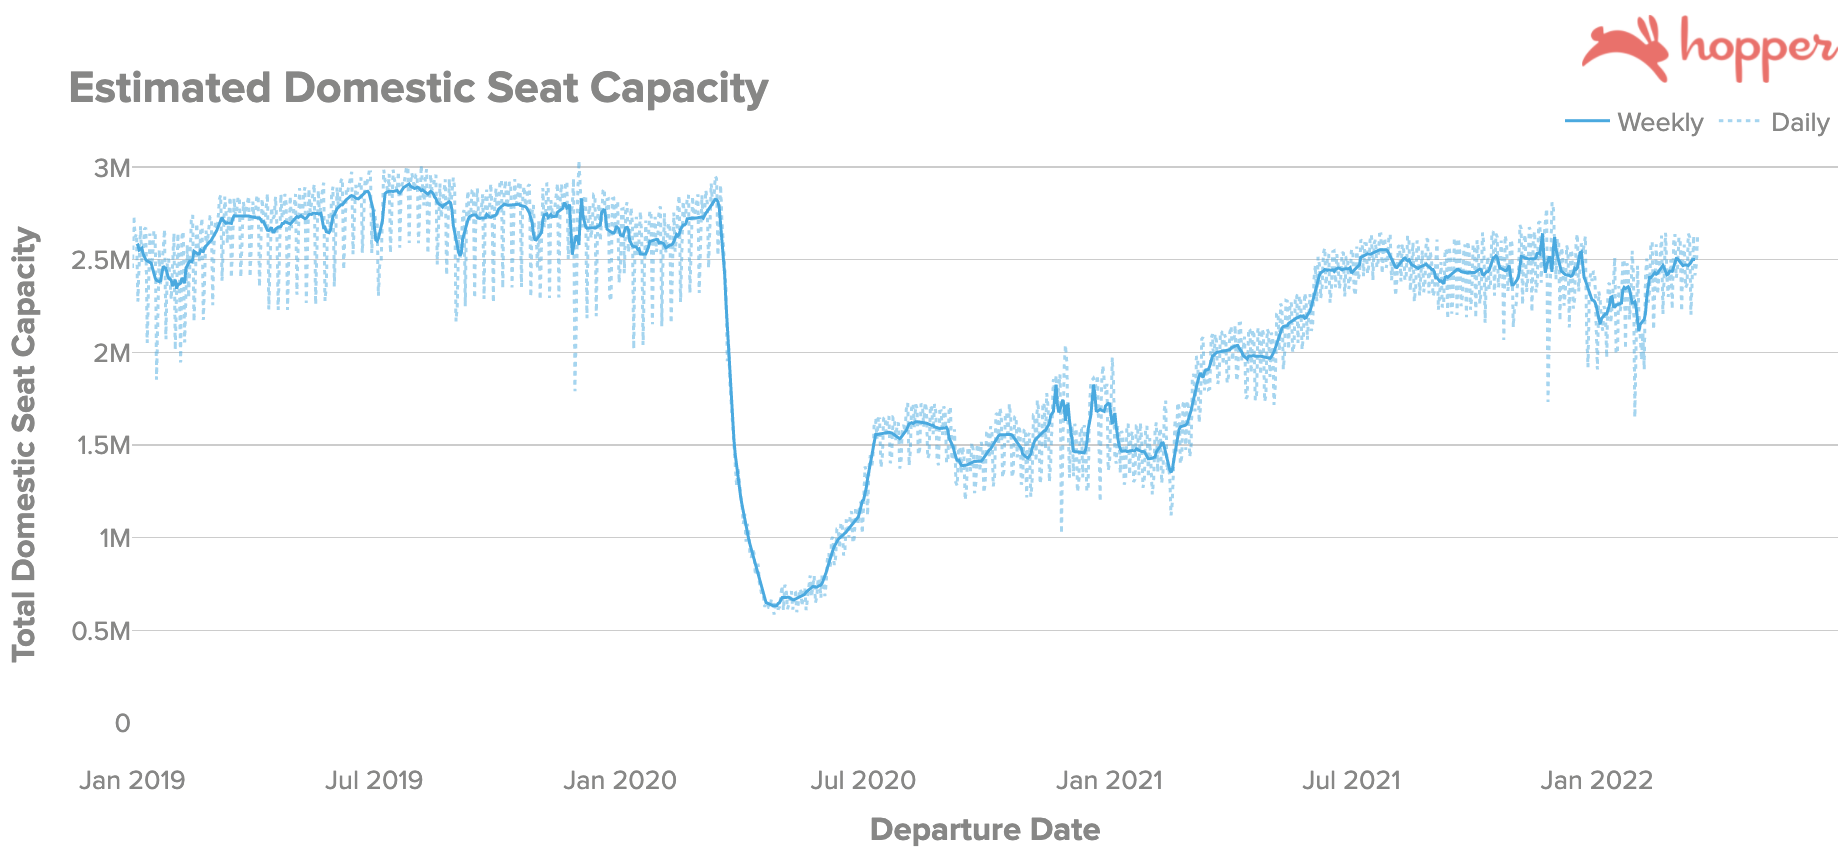
Seat Capacity: We still expect carriers to gradually increase capacity for the upcoming summer months to capture higher seasonal travel demand, but these increases are likely to be more moderate as airlines contend with higher fuel costs. At 2.5m seats/day, currently U.S. domestic seat capacity is down ~8% from 2.72m seats/day this time in 2019.
International Consumer Airfare Prices + 6-Month Forecast
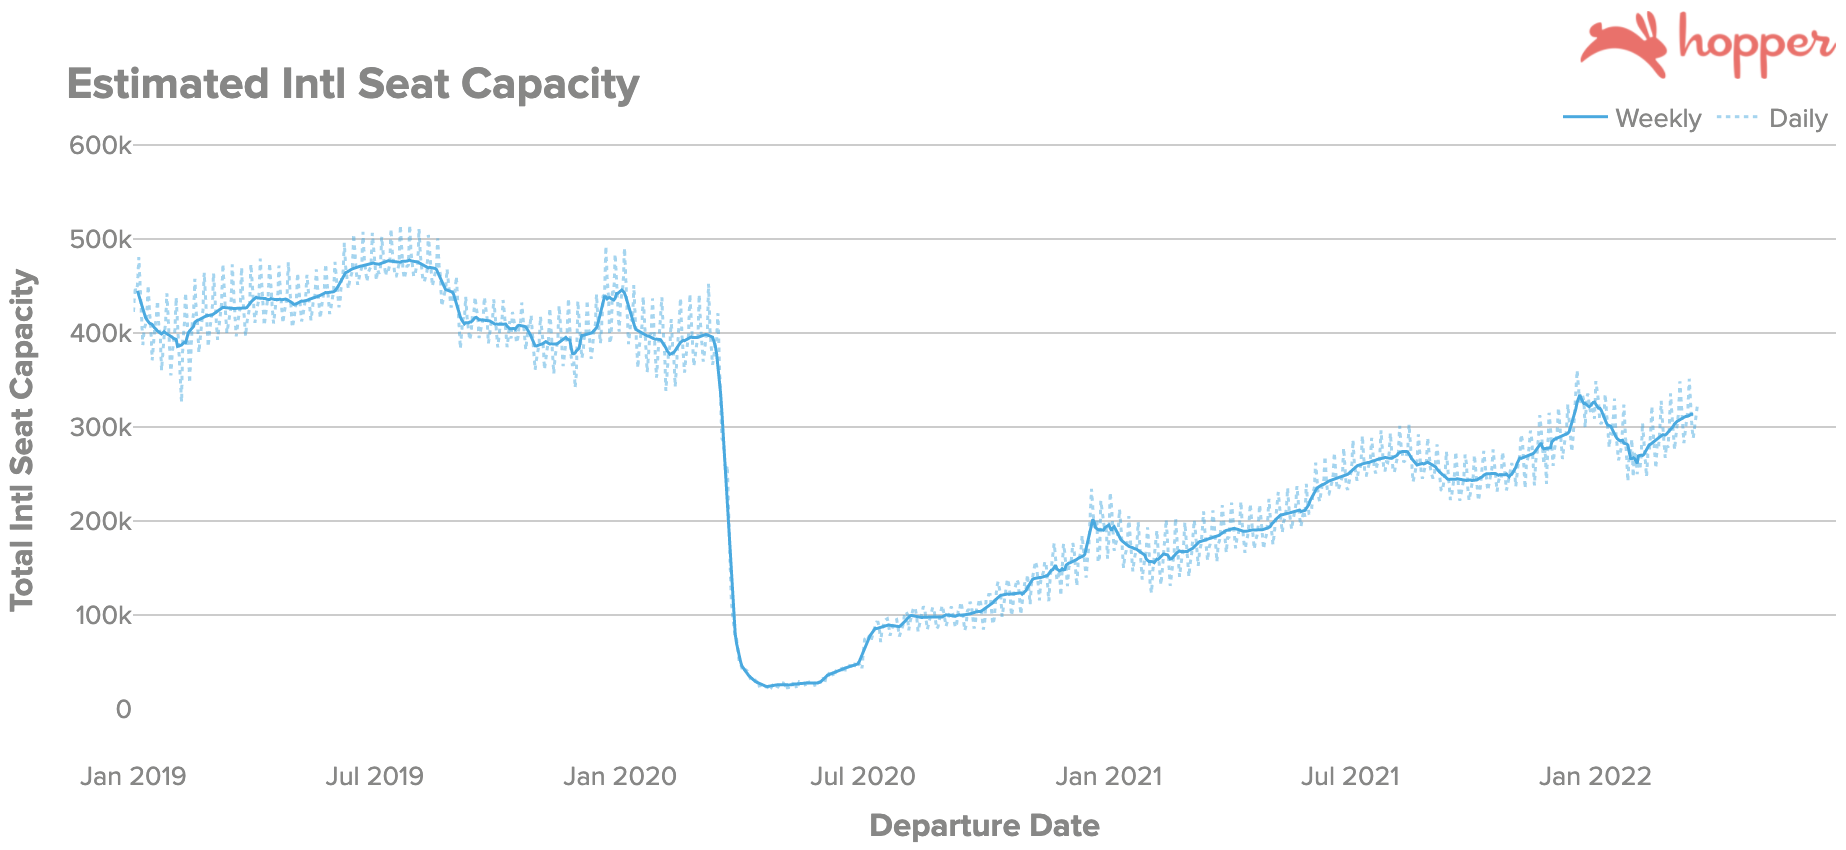
Similar to the domestic U.S. market, many of the same factors have contributed to a material quarterly increase in international airfare for international flights from the U.S., which at $810/round-trip trends just 2% below 2019 prices of $830/round-trip in late March. International airfare is up 25% from $650/round-trip at the start of the year. At around 313k seats/day, international seat capacity remains down ~25% from this time in 2019, meaning the segment is relatively further from being fully recovered compared to the domestic market. However, the broad reopenings of several Asian countries (such as the Philippines, Indonesia, South Korea, Thailand, and India) and Australia have boosted the Trans-Pacific market, while the Trans-Atlantic market has proven strong demand post-Omicron (even amidst the Russia/Ukraine conflict moderately dampening demand for flights to Europe).
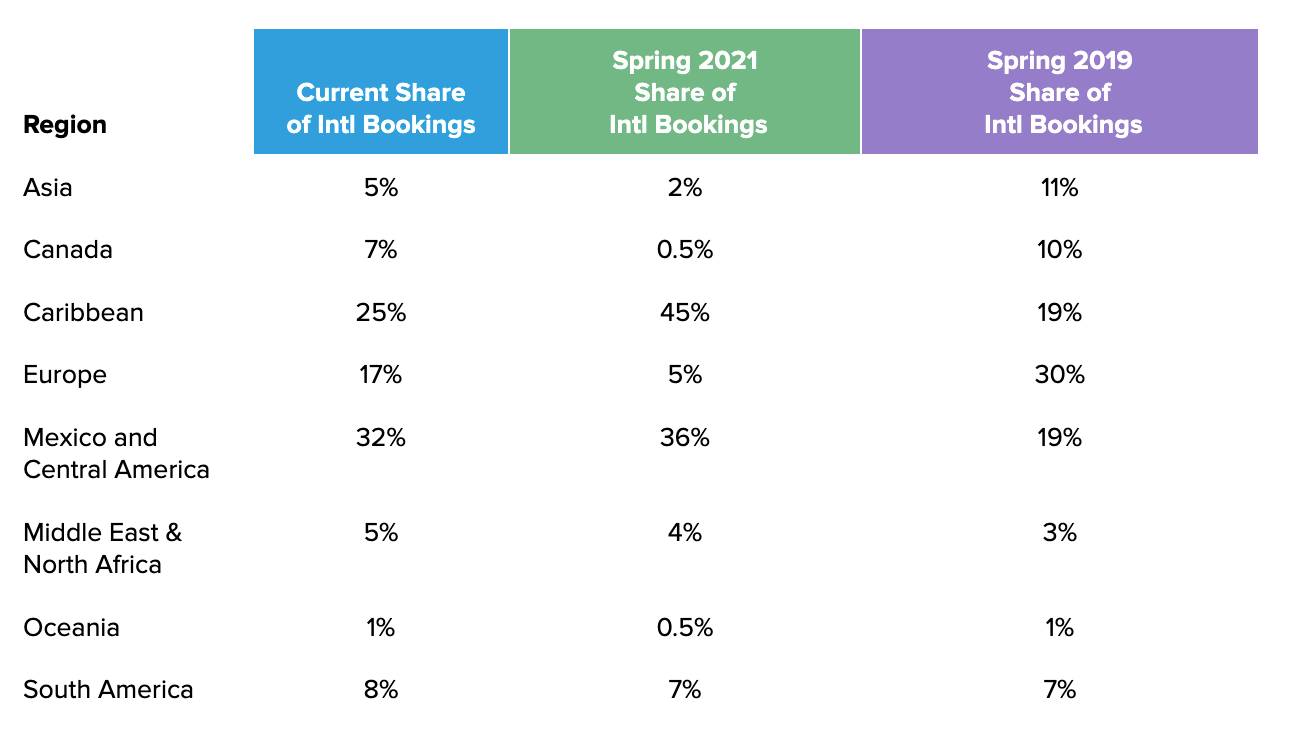
We’re seeing much improved demand to Canada from this time last year, with Canada now accounting for 7% of our outbound U.S. international bookings compared to just over 0.5% during strict travel restrictions this time in 2021. However, this remains down from 10% this time in 2019.
International Airfare Forecast by Month
We are forecasting international airfare to match 2019 prices until May, before picking up more into June. We think there is still significant pent-up international travel demand for the summer, given how significantly we are seeing searches increase for recently reopened countries. For example, Seoul, South Korea went from being the 26th most searched international destination to being just outside the Top 10 most searched international destinations just days following its reopening. We are forecasting international airfare to top out at $940/round-trip in June, a 15% increase from current prices and about 5% above 2019 prices, before declining seasonally into the fall.
Factors Affecting International Airfare
In general, the factors affecting domestic airfare are also very much the same ones at play in the international segment. However there are a few differences worth considering. With several Asian countries reopening or easing travel restrictions, we could see a material recovery in trans-Pacific travel from the U.S., whereas the domestic market has already seen a more complete demand recovery to near pre-pandemic levels. In addition, with the closure of Russian airspace and on generally longer-haul routes, higher jet fuel prices could have a more significant impact on airfares.
Factors Affecting International Airfare
Varying Travel Demand:
Trans-Atlantic: We saw flight searches for trans-Atlantic flights to Europe dip 9% below expected levels in the two weeks following the escalation of the Russian-Ukraine conflict on February 24th. The dampened demand for Europe was on the heels of otherwise quickly recovery flight demand in early February as Omicron subsided in the U.S., and the net effect has been that flight searches to Europe have only slightly declined since late February, decreasing just 5% since February 24th. Airfare to Europe remains high, at $800/round-trip, up 18% from $680/round-trip since the start of the year and up 5% since February 24th, when the invasion of Ukraine occurred.
Trans-Pacific: We believe there is still significant pent-up demand to be seen play out on the Trans-Pacific market, particularly with the reopening of many major Asian countries that have been closed for over 2 years.
Jet Fuel Prices: Higher jet fuel prices will have a significant impact on long-haul international flights as well, contributing to higher airfare. Particularly with the closure of Russian airspace, longer flights circumventing the country and requiring more jet fuel to do so could further contribute to higher fares.
Seasonal Effects: Similar to the domestic market, we expect to see international airfare peak in the summer with higher seasonal travel demand.
Capacity: International capacity remains down ~25% from this time in 2019, which is a slight improvement from being 28% down last quarter. With the broader reopening of several Asian markets, we are likely to see the gap to 2019 levels close more. That being said, we still haven’t seen signs of reopening from two of the largest trans-Pacific markets–China and Japan.
Searches | Late Spring - Early Summer 2022 Destinations
Most Popular Methodology: Hopper collects, from several Global Distribution System partners, 25 to 30 billion airfare price quotes every day from searches happening all across the web. Here we simply rank destinations by which ones have received the most searches in the last 2 weeks, filtering for late spring / early summer departures dates (April 1st to June 30th, 2021). Compared to the Q1 2022 index where we looked back at 6 weeks of searches,, we used the last 2 weeks to get the best representation of destination demand in the post-Omicron environment. Think of most popular as a measure of “Where are most people thinking of going?” Note that this does tend to favor larger cities.
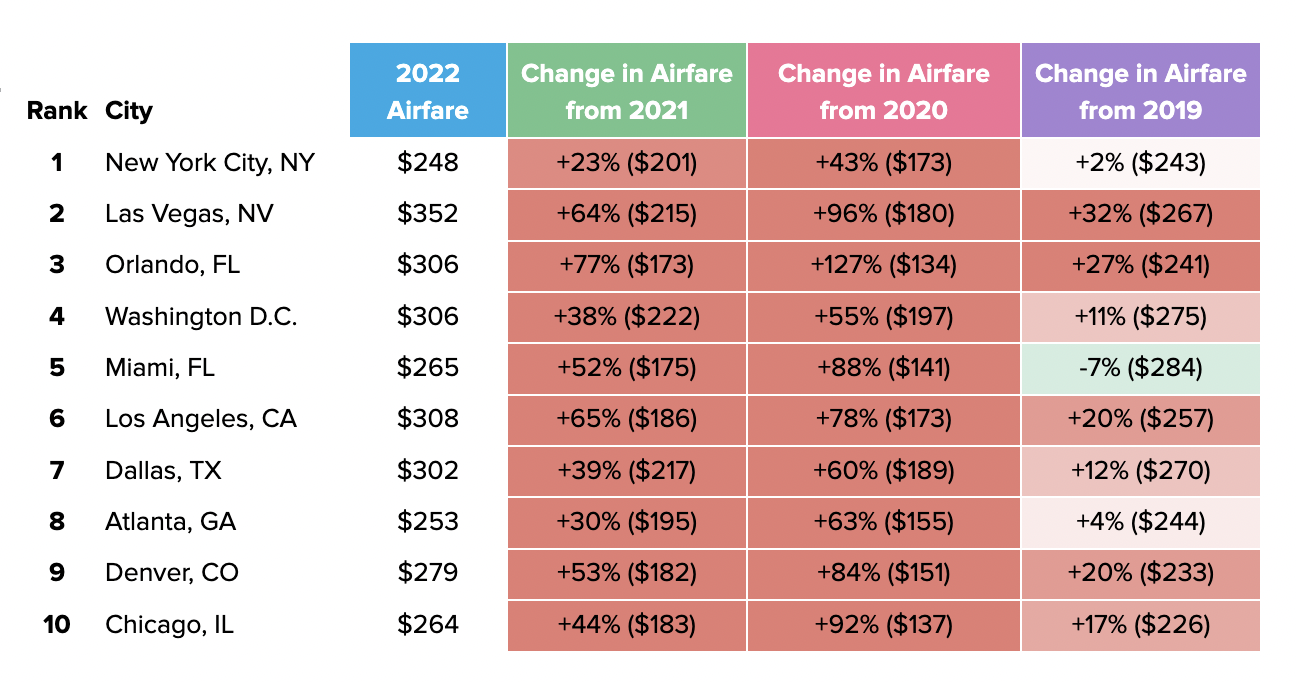
Domestic: New York City, NY (#1), Las Vegas, NV (#2), and Orlando, FL (#3) topped the most popular destinations in searches for domestic flights. With airfare of just $248/round-trip, New York was one of the most affordable domestic destinations, a title we would usually see going to Miami/Fort Lauderdale. At $352/round-trip, Las Vegas was one of the most expensive popular domestic destinations, representing a sizable 32% increase in airfare over even 2019 prices at this time.
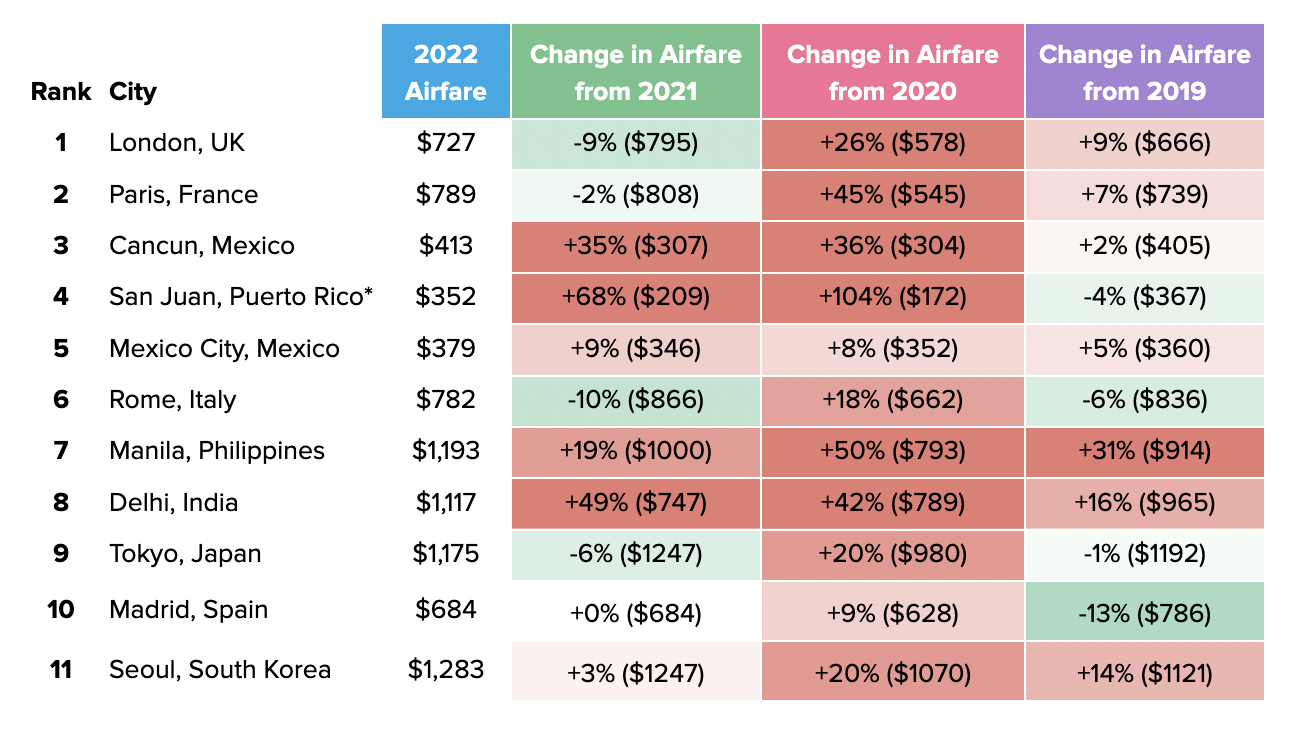
International: London, UK (#1), Paris, France (#2), and Cancun, Mexico (#3) were our most searched international destinations again this quarter. 4/10 of the most searched international destinations from the U.S. were in Europe, suggesting there is still high demand for travel to Europe even amidst the ongoing conflict in Ukraine/Russia. New Trans-Pacific destinations to the list from last quarter are Manila, Philippines (#7) and Seoul, South Korea (#11), with demand likely boosted from reopenings. Interestingly, Tokyo was our 9th most searched destination and also new to the list, although Japan remains closed to foreign tourists, which could suggest strong pent up demand. San Jose, Costa Rica (previously #7), Dubai, UAE (previously #8), and San Salvador, El Salvador (previously #9) fell out of the Top 10.
Most Searched Domestic Destinations
Most Searched International Destinations
Highest Trending Methodology: We use our search traffic data to track the rate of increase in searches for a destination in recent weeks. We rank cities by their rate of increase in search volume. This does not necessarily represent what’s most popular with travelers, but rather what’s becoming more popular the quickest.
Domestic: Houston, TX (#1), Chicago, IL (#2), and Atlanta, GA (#3) were the highest trending domestic destinations for the late spring / early summer.
International: Seoul, South Korea (#1), Mexico City, Mexico (#2), and Delhi, India (#3) were the highest trending international destinations for the late spring / early summer.
Highest Trending Domestic Destinations
Highest Trending International Destinations
Bookings | Late Spring - Early Summer 2022 Destinations
Please note: Since Hopper users tend to skew towards younger leisure travelers, our bookings also tend to reflect this demographic’s interests. We’d suggest “Most Popular in Searches” above for popular destinations more representative of the overall population.
Domestic: Las Vegas, NV (#1), Orlando, FL (#2), and New York City, NY (#3) were the most booked domestic destinations on Hopper, matching the most searched destinations industry-wide.
International: Cancun, Mexico (#1), San Juan, Puerto Rico (#2), and Mexico City, Mexico (#3) were the most booked international destinations among our users. Outside of the consistently popular Mexico and Caribbean region, London (#7), Toronto (#10), and Dublin (#11) were some of our most booked international destinations.
Where is Demand Clustering?
We look at future departure dates where searches for flights are higher than usual to get a sense of when future travel demand is clustering. In our Q1 2022 Index, we saw demand most strongly clustering around President’s Day weekend and mid-March, which gave us a rough timeline for when we expected the recovery in post-Omicron travel demand.
Domestic | mid-April to early May, and upcoming National Holidays
Going forward in the domestic market, we’re seeing demand cluster in mid-April, but otherwise it is mostly concentrated around national holidays such as Memorial Day, July 4th, and Labor Day.
International | mid-April and Memorial Day Weekend
International search demand has fewer discernible clusters aside from mid-April and Memorial Day weekend. We detail clusters for each major international region below.
How far in Advance are Travelers Booking Flights?
Since Summer 2020, we’ve seen travelers booking closer to their date of departure. This makes sense in an environment where there can be uncertainty about how travel regulations and the pandemic itself will progress further down the line. How far travelers book in advance is one signal of traveler confidence, and here we compare it to pre-pandemic levels for context.
Domestic | 41 Days
Travelers are booking domestic flights 41 days in advance on average, down from 50 days this time in March 2019, and about the same as this time last year in March 2021. We saw booking advance spike to 45 days between late February and early March before easing a bit in recent weeks. Given the timing with the Ukraine/Russia conflict outbreak, this could be a result of relatively more travelers booking flights further out in the year (potentially to avoid higher airfares due to higher jet fuel prices), or relatively fewer travelers making last minute bookings for spring break in March due to high last minute prices.
International | 65 Days
Travelers are booking international flights 65 days in advance on average, down from 79 days this time in March 2019, and about the same as this time last year in March 2021.
International booking advance has also increased quicker since late February, but unlike domestic advance, has remained higher going into April.
Get the Hopper app to find the best deals.
You could save up to 40% on your next flight!
